

What does a candle with no wick mean? It shows that the price opened at one extreme and closed at the other, so buyers or sellers controlled the whole session, and its location on the chart decides whether it signals continuation, a breakout, exhaustion, or simply thin trading.
Key Takeaways
- A wickless candle, called a marubozu, forms when the open and close land exactly on the period’s high and low.
- A green marubozu shows buyers in charge for the entire period, while a red one shows sellers in charge.
- A marubozu matters most when its body is large compared with recent candles and it appears at a key price level.
- On Heikin-Ashi charts, a missing wick means something different: a steady trend, not a single session of control.
- Low volume, extended-hours data, or a trading halt can produce a wickless candle that carries no real information.
What Is a Candle With No Wick?
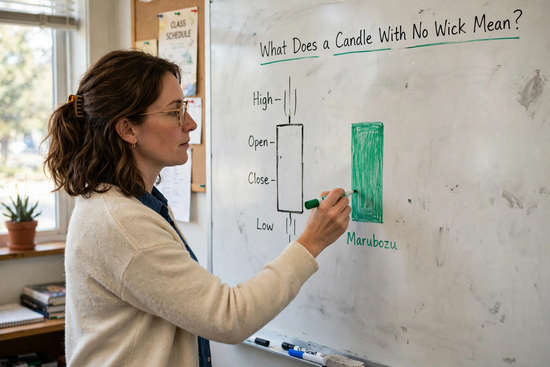
A candle with no wick is a candlestick whose body covers the period’s entire price range, because the open and close sit on the high and low.
Each candlestick shows four prices: opening, highest, lowest, and closing. Its wide body stretches between the opening and closing. The thin lines above and below, called wicks or shadows, mark how far the price traveled beyond the body before pulling back.
Anyone learning how to understand candlestick patterns starts with these four prices, since every named pattern is just a particular arrangement of them. Green (or white) bodies close higher than they opened. Red (or black) bodies close lower.
Japanese rice traders called the wickless shape a marubozu, roughly “shaved head,” because nothing sticks out of either end. Most charting software also accepts near-misses where a wick is a few cents long. You may also see it called a shaved candle, a full-body candle, or a candle without shadows.
What Does a Candle With No Wick Mean on a Stock Chart?
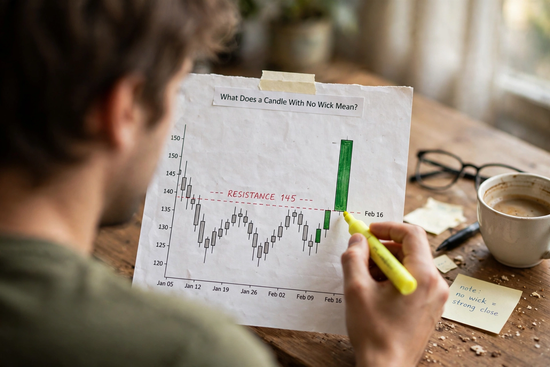
It means one side never lost control. Price never traded beyond the open or the close, so nobody pushed back hard enough to leave a wick, and that one fact supports seven different readings depending on context.
1. Full Buyer Control (Green Marubozu)
The price opened at the low and closed at the high. Every dip got bought. When three strong green candles appear in a row with
Rising closes, traders call the pattern three white soldiers, one of the strongest continuation signals on a daily chart.
2. Full Seller Control (Red Marubozu)
This is the mirror image: open at the high, close at the low. Investors who hunt for value stocks often see this candle after an earnings miss. They wait for selling volume to dry up before buying, because a red marubozu shows that forced sellers haven’t finished yet.
3. Opening Marubozu
Only the open end has no wick. A green opening marubozu, also called a bullish belt-hold line, opens at its low and rallies, then leaves a small upper wick as buyers ease off before the close.
4. Closing Marubozu
Only the close end is clean. The price finished at the extreme, so pressure was still building at the bell. Traders read this as unfinished business, especially when the next session opens with a gap in the same direction.
5. Breakout Confirmation
A green marubozu that closes above a resistance level, such as a prior swing high, shows conviction behind the break. Breakout candles with long upper wicks tend to fail more often , because sellers have already rejected the higher prices.
6. Climax or Exhaustion
After eight or ten straight-up days, an unusually large wickless candle often reflects the last wave of late buyers piling in. If the next candle opens lower and closes below the marubozu’s midpoint, the move has likely run out of fuel.
7. A Data Artifact
Some wickless candles mean nothing. One-minute bars on thinly traded shares, extended-hours sessions, and charts that exclude pre-market prints can show a “perfect” marubozu simply because so few transactions happened in that window.
What Does a Candle With No Upper Wick Mean?
A candle with no upper wick means the price never traded above the body’s top. On a green candle, that means it closed at the high, so buyers were still pushing at the close. On a red candle, it means it opened at the high, so sellers took over from the first trade and never let price recover.
What Does a Candle With No Lower Wick Mean?
A candle with no lower wick means price never traded below the body’s bottom. On a green candle, that means it opened at the low, so buyers stepped in from the first trade, which is the bullish belt hold. On a red candle, it means it closed at the low, so sellers were still pressing at the close, which often leads to more weakness the next session.
Does a No-Wick Candle Mean the Same Thing on Heikin-Ashi Charts?
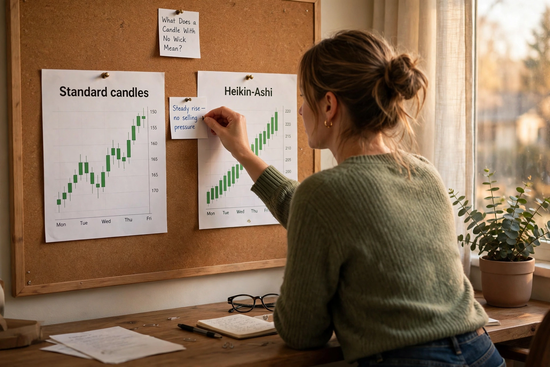
No. On a Heikin-Ashi chart, a missing wick signals a smooth, persistent trend, not one session of total control.
Heikin-Ashi candles use averaged prices. Each close equals the average of the period’s open, high, low, and close, and each open equals the midpoint of the previous Heikin-Ashi candle’s body. That smoothing makes wickless candles far more common.
A green Heikin-Ashi candle with no lower wick shows a strong uptrend, and a red one with no upper wick shows a strong downtrend. Small bodies with wicks on both sides warn that the trend is stalling.
Because those prices are averages, they don’t match where shares actually traded. Whether you pull a ticker from 5starsstocks .com or a broker screener, check which candle type your chart displays before reading the wicks, and place orders using standard candle prices.
How Do You Confirm a No-Wick Candle Before Acting?
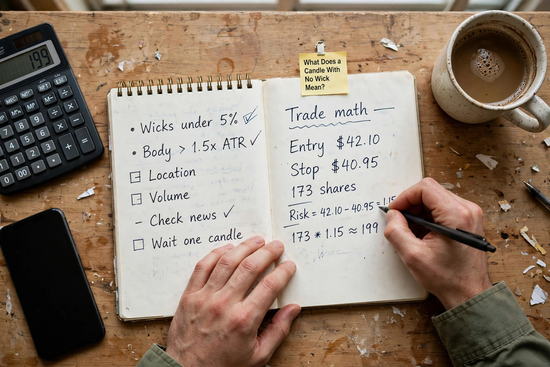
Confirm it with size, location, volume, and the next candle. One wickless candle describes the past session, and it predicts nothing alone.
- Measure the wicks. Divide each wick by the candle’s total range. If both come in under 5%, treat the candle as a marubozu.
- Compare the body with the average range. Check the 14-day average true range (ATR). A body at least 1.5 times the ATR is significant, and one below the ATR is just a quiet day.
- Check the location. Ask whether the candle broke a level, sits mid-range, or caps a long run.
- Compare the volume. Look for at least 1.5 times the 20-day average volume.
- Rule out news and data quirks. Earnings, a halt, or an extended-hours setting can distort the shape.
- Wait one candle. A follow-through candle that holds above the midpoint confirms the move.
This checklist is the backbone of how to read candlestick charts for beginners: you test the pattern against the evidence before you name it.
Worked Example: Sizing a Trade for a Marubozu
A stock opens at $40.00, hits a low of $40.00 and a high of $42.00, and closes at $41.98. The upper wick is $0.02, which is 1% of the $2.00 range. The body is $1.98, and against a 14-day ATR of $1.20, that comes to 1.65 times the ATR, so the candle passes both size tests.
The next morning you buy at $42.10, as the price clears the high. With a stop at $40.95, just under the $41.00 midpoint, your risk is $1.15 per share. Risking 1% of a $20,000 account ($200) allows 173 shares, a $7,283.30 position.
Moving the stop under the low to $39.95 raises the risk to $2.15 per share and cuts the size to 93 shares. A wider stop-loss calls for a smaller position, so your dollar risk remains constant.
How Is a Marubozu Different From Hammers and Hanging Men?
A marubozu has no wicks, while hammers and hanging men are defined by one long lower wick. The marubozu shows control; long-wick candles show rejection.
The hammer vs hanging man candle comparison comes down to location, because the two shapes are identical. Both have a small body near the top of the range and a lower wick at least twice the body’s length. A hammer appears after a decline and hints at a bottom. A hanging man appears after an advance and warns of weakening demand.
| Candle | Wick structure | Typical location | What it suggests | Confirmation to wait for |
| Green marubozu | None | Early trend or breakout | Buyers in full control | The next candle holds above the midpoint. |
| Red marubozu | None | Early downtrend or breakdown | Sellers in full control | The next candle stays below the midpoint. |
| Bullish belt hold | No lower wick, short upper wick | After a decline | Buyers took over from the open. | Higher close next session |
| Hammer | Long lower wick | After a decline | Sellers rejected at lows. | Close above the hammer’s high. |
| Hanging man | Long lower wick | After an advance | Buying support weakening | Close below the hanging man’s body |
| Inverted hammer | Long upper wick | After a decline | Buyers testing higher prices | Higher close next session |
| Four-price doji | No wicks, nobody | Halted or illiquid trading | No information | Ignore it. |
Why Do Beginners Misread Wickless Candles?
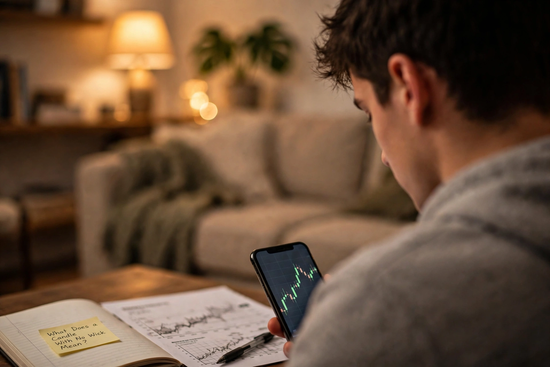
Most misreadings come from treating the shape as a command instead of evidence. The mistakes below show up most often, and each has a simple fix.
Mistake 1: Ignoring Location
A marubozu in the middle of a sideways range means far less than one that breaks a level. The fix is to mark support and resistance before you study the candle.
Mistake 2: Judging by Color Alone
Beginners often assume every green wickless candle is bullish. Is a green marubozu at the top of a long rally still a buy signal? Not necessarily. After eight or ten up days, the same shape can mark exhaustion, so the candle’s location and the next session matter more than its color.
Mistake 3: Following Viral Chart Calls
On the investor knowledge quiz in the FINRA Investor Education Foundation’s December 2025 investor report, respondents averaged 5.3 correct answers out of 11. The same report found that 26% of investors act on finfluencer recommendations, rising to 61% among those under 35.
A score of 5.3 out of 11 means fewer than half the answers were correct. So short videos that call every green marubozu a buy signal are reaching an audience poorly equipped to question them. The fix is to run the six-step checklist yourself before you act on anyone’s chart call.
Should Long-Term Investors Care About Candles With No Wicks?
Mostly no. A single daily candle rarely changes the case for a holding you plan to keep for years.
Gallup’s 2025 survey found that 62% of U.S. adults own stock, counting shares held through mutual funds and retirement accounts such as 401(k)s and IRAs. If your money sits in a target-date fund you rarely touch, no candle shape should prompt a trade.
People who hold passive stocks through index funds can skip candle reading entirely. Weekly charts are the one view worth an occasional glance, since a weekly marubozu reflects five sessions of one-sided pressure rather than a single afternoon.
One exception overrides every reading above. When a stock is halted or trades only once in a session, the open, high, low, and close can all match, which leaves a flat dash called a four-price doji. That candle has no wick and no body, and it records only an absence of trading, so treat it as a blank, not a signal.
FAQ
Is a candle with no wick bullish or bearish?
It depends on the body’s color and where the candle appears. A green marubozu is bullish and a red one is bearish, but either one can mark exhaustion after an extended run.
What is the difference between a marubozu and a long candle?
A marubozu has no wicks, while a long candle simply has a large body. A long candle with sizable wicks shows that the opposing side pushed back during the session, which weakens the signal.
How common is a true marubozu?
Perfect wickless candles are uncommon on daily charts of heavily traded shares. Most candles labeled marubozu carry tiny wicks, which is why the 5% wick-to-range rule works as a practical filter.
Which timeframe gives the most reliable marubozu signals?
Daily and weekly charts give the most reliable readings. One- and five-minute bars produce many wickless candles from brief order imbalances that reverse within minutes.
Can a marubozu appear on crypto or forex charts?
Yes, it appears on any market charted with candlesticks. Those markets trade around the clock, so the platform’s time-zone setting decides where each candle starts and ends.
Should I buy right after a green marubozu closes?
Waiting for the next candle before buying is the safer approach. A follow-through session that holds above the midpoint confirms demand and gives you a defined level for your stop.
Conclusion
So what does a candle with no wick mean? It means one side owned the session from the first trade to the last. Size, location, volume, and the next candle decide whether that control continues, breaks out, or burns out.
This article is for educational purposes only and is not financial advice. Do your own research or consult a licensed advisor before trading.


One comment on “What Does a Candle With No Wick Mean? 7 Possible Interpretations”