

The answer to what is a good P/E ratio for a stock depends on industry and growth, but a reading between 15 and 25 covers most profitable, mature U.S. companies, and the broad market currently sits near 19 times forward earnings. A P/E at or below its sector’s average, paired with rising earnings, usually signals fair or attractive value.
Key Takeaways
- The P/E ratio divides a company’s share price by its earnings per share, telling you how much investors pay for every dollar of yearly profit.
- A “good” P/E is relative, so judge a company against its own industry and its own five-year history rather than one universal number.
- Trailing P/E uses the last 12 months of reported profit, while forward P/E uses analyst estimates, and a wide gap between them roughly signals how much growth the price assumes.
- The PEG ratio divides P/E by expected earnings growth, and a reading near 1.0 means the price roughly matches the growth on offer.
- A very low P/E sometimes flags a value trap, especially in cyclical industries where profits sit at a temporary peak.
What Is a P/E Ratio?
The price-to-earnings ratio takes a company’s share price and divides it by earnings per share for a given period, giving a multiple.
Picture a company trading at $50 that earns $2.50 per share each year. Its P/E is 20, so buyers pay $20 for every $1 of profit the business generates.

What Is a Good P/E Ratio for a Stock Right Now?
For a broad, profitable U.S. company in late 2026, a forward P/E near 18 to 20 lines up with the overall market and counts as fair. Anything far above that range needs faster earnings growth to justify the price.
In FactSet’s Earnings Insight report from fall 2026, the S&P 500 sat at 18.7 times forward 12-month earnings, slightly under its 10-year average of 19.1, with a trailing multiple of 25.7.
Run the numbers. Dividing 25.7 by 18.7 gives about 1.37. Part of that gap reflects the profit growth analysts expect, but part can come from differences in how trailing and forward earnings are measured, so treat it as a rough gauge of market optimism rather than an exact growth forecast.
Flip the forward multiple upside down and you get the earnings yield: 1 ÷ 18.7 equals about 5.3%. That figure is the profit you effectively own per dollar invested, and it gives you a fair way to weigh shares against a CD or Treasury bill.
Interest rates shape what “fair” means. When bond yields climb, investors demand a higher earnings yield from shares, which pushes P/E ratios down; when rates fall, multiples tend to expand even if profits stay flat.
Why Do P/E Ratios Vary So Much by Industry?

Industries grow at different speeds and carry different risks, so investors pay different multiples for each. A grocery chain and a chip designer will never share the same “normal” P/E.
Consumer staples makers sell toothpaste and cereal through booms and recessions alike, so their earnings rarely surprise anyone. Chip and software firms tied to AI demand can grow profits far faster, and buyers pay a premium for that upside, along with the risk that it fades.
| U.S. industry | Forward P/E (January 2026) | What a beginner should take from it |
| Money-center banks | 13.04 | Low multiples are standard here; 13 is not automatically cheap |
| Household products | 16.85 | Steady demand earns a modest premium, not a growth multiple |
| Food processing | 17.23 | Slow sales growth keeps valuations in the high teens |
| Utilities (general) | 18.13 | Regulated, dividend-heavy firms trade close to the market level |
| Software (system and application) | 34.13 | Recurring subscription revenue earns a high multiple |
| Semiconductors | 37.29 | Richest group shown; profits swing with chip cycles |
Source: Aswath Damodaran, NYU Stern, PE Ratio by Sector (US), January 2026 update. All figures are forward P/E.
These industry figures blend every listed U.S. company in each group, small and unprofitable ones included, and date from January 2026. The market benchmark in the previous section is from fall 2026 and covers only the 500 largest firms, so treat them as two separate yardsticks.
Here’s the practical payoff. A software company at 28 times forward earnings sits below its peer group, while a food company at 28 trades at a steep premium to its peers.
How Do You Know If a P/E Is Too High?

A P/E is too high when it sits well above both its industry median and the company’s own five-year range without faster earnings growth to match. Two quick checks catch most overpriced stocks.
Trailing vs. Forward P/E
Trailing P/E rests on reported results, so it’s reliable but backward-looking. Forward P/E rests on estimates, which makes it timely yet dependent on analysts getting profits right.
Check both numbers side by side. Stock-pick sites such as 5starsstocks .com and most free screeners show a P/E figure without always labeling which kind it is, so confirm whether you’re looking at trailing or forward P/E before comparing two companies. Mixing a trailing figure with a forward one manufactures false bargains.
The PEG Ratio Check
Divide the P/E by the expected annual earnings growth rate, entered as a whole number. A result under 1.0 suggests a bargain relative to growth; above 2.0 signals a rich price.
Take two companies. Company A trades at 30 times earnings with 20% expected growth, for a PEG of 1.5, whereas Company B trades at 15 times with 4% growth, for a PEG of 3.75. The one that looks expensive is actually cheaper per unit of growth.
How Should Beginners Use P/E to Build a Watchlist?
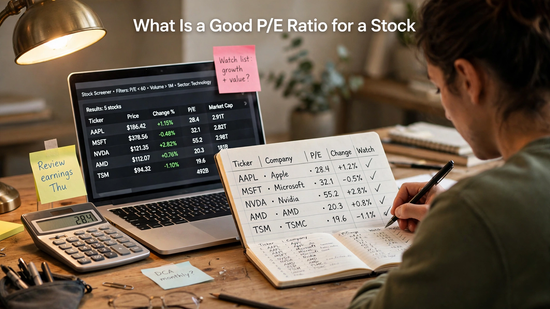
Use P/E as a first filter, never as a final verdict. It narrows a list of candidates quickly, but cash flow, debt, and growth decide the purchase.
If you’re learning how to choose stocks for long term investing, this five-step routine turns P/E into an actual buying plan:
- Pull both the trailing and forward P/E for the company.
- Compare each against the industry median and the company’s own five-year average.
- PEG equals the forward P/E divided by the expected growth rate.
- Review debt, free cash flow, and payout ratio, since income stocks need dividends that earnings comfortably cover.
- Set a buy price by multiplying forward earnings per share by the five-year average P/E, then wait for the market to offer it.
Step five in action: a company expected to earn $4.00 per share, with a five-year average P/E of 18, gets a target price of $72. Above that, you’re paying for optimism.
What Is the Biggest P/E Mistake Beginners Make?

Buying shares only because the P/E is low. Low multiples often reflect profits at a cyclical peak that are about to shrink.
The cause is simple. Screens built to find value stocks sort by lowest P/E, and steelmakers, automakers, and shippers top those lists exactly when their earnings hit record highs.
Consider a steel company earning $10 per share at the top of the cycle and trading at $60, a P/E of 6. Demand cools, earnings drop to $3, and even with the price frozen at $60, the P/E jumps to 20.
The fix: average the company’s earnings across a full business cycle, usually seven to 10 years, and divide the current price by that figure. Economists apply the same idea to the whole market through the cyclically adjusted P/E, or CAPE. If a company still looks cheap on normalized profit, the bargain is more likely real.
When Should You Ignore the P/E Ratio?
Skip the P/E for money-losing companies, and handle it carefully when accounting earnings understate cash flow. Aswath Damodaran’s January 2026 industry data at NYU Stern classified 57.16% of the 5,994 U.S.-listed firms it tracks as money-losing over the trailing year, which works out to roughly 3,426 companies with no meaningful P/E at all. For them, price-to-sales and cash burn tell you far more. Real estate investment trusts form another exception, because heavy depreciation charges shrink reported profit, so analysts value them on funds from operations instead.
Frequently Asked Questions
Is a P/E ratio of 20 good?
A P/E of 20 is reasonable for a stable, profitable company growing earnings at a mid-to-high single-digit pace. For a slow-growing utility, 20 leans expensive, while for a fast-growing software firm, it looks cheap.
Is a lower P/E ratio always better?
No, a low P/E only helps when earnings are stable or rising. A falling share price or temporarily inflated profits can drag the multiple down while the underlying business weakens.
What P/E ratio is considered overvalued?
No fixed cutoff exists, but a P/E far above both the industry median and the company’s own history signals overvaluation. A PEG above 2 strengthens that conclusion.
Can a P/E ratio be negative?
Yes, a P/E turns negative when a company reports a net loss. Most data providers display “N/A” in that case, since a negative multiple tells investors nothing useful.
Should beginners use trailing or forward P/E?
Beginners should use both, because each covers the other’s blind spot. A wide gap between them gives a rough sense of how much future growth the current price already assumes.
Conclusion
Asking what is a good P/E ratio for a stock leads to a relative answer, not a fixed number: the right multiple matches the company’s industry, growth rate, and earnings quality. Compare against peers, run the PEG, and normalize cyclical profits before trusting a low reading. A fair P/E backed by durable earnings growth beats a cheap P/E on shrinking profits nearly every time.
This article is for educational purposes only and is not financial advice. Do your own research or consult a licensed advisor before investing.