
Does a red inverted hammer still count? Yes, because the pattern depends on a small body, a long upper wick, and a prior downtrend, while a red body only means price closed slightly below its open, which signals weaker buyers and makes a higher close the next day essential.
Key Takeaways
- An inverted hammer counts whether its body is red or green, because shape and location define the pattern.
- A valid candle needs a prior decline, a small real body near the session low, and an upper wick at least twice the body’s height.
- A green body shows slightly stronger buyers, yet the color gap usually equals cents against a wick worth dollars.
- No inverted hammer becomes a buy signal until the next candle closes above its body or, for a stricter test, above its high.
- The identical shape after a rally is a shooting star, so the trend before the candle decides its meaning.
What Is an Inverted Hammer?
An inverted hammer is a single candlestick that appears after a decline, with a small real body near the session low, an upper wick at least twice the body’s height, and little or no lower wick.
Its body color records one detail only: whether the close landed above the open (green) or below it (red).
Does a Red Inverted Hammer Still Count as an Inverted Hammer?
Yes, a red inverted hammer is still the same pattern as a green one. Candlestick rules define it by proportions and position, not by the shade of the body.
The market story stays intact either way. Sellers owned the trend, buyers launched a sharp intraday rally, and sellers dragged price back toward the low before the closing bell. That rejected rally matters because it marks the first serious demand in days.
A red close tells you sellers won the final stretch of the session by a few extra cents. When you scan U.S. stocks for this setup, include both colors, since filtering out red bodies throws away valid signals.
Run five checks before you label any candle:
- Confirm a prior decline of at least three lower closes.
- Measure the upper wick and make sure it reaches twice the body’s height or more.
- Check that the lower wick stays under roughly 10% of the full range.
- Compare volume with its 20-day average; a heavier session shows the rally attempt drew real participation.
- Set color aside until the end, then use it only to grade strength.
How Much Difference Does a Red Body Really Make?

Usually very little. The gap between a red close and a green close tends to equal a thin slice of the candle’s full range.
Picture a healthcare share sliding from $52 to $47 over six sessions after weak guidance, then printing this candle:
- Open: $47.10
- High: $49.00
- Low: $46.60
- Close: $46.80
The range spans $2.40, the body measures $0.30, and the upper wick covers $1.90, more than six times the body.
Now flip the color. Open at $46.80, close at $47.10, with the same high and low.
The red candle closes 8% of the way up its range and surrenders 92% of the intraday rally. Its green twin closes 21% of the way up and gives back 79%. Buyers in the green version held $0.30 more per share, a real but modest edge.
Use color as a tiebreaker, not a filter. Facing a red inverted hammer, raise the bar for confirmation and wait for a close above the $49.00 high instead of settling for a close above the body.
When Color Means Even Less: 24-Hour Markets
In round-the-clock currency markets, body color and even the confirmation candle carry less weight than on daily equity charts.
A ForexOp test of currency pairs found that on four-hour charts, inverted hammers followed by a confirming candle still saw the decline resume 52.9% of the time. That result sits barely above a coin flip, and forex candles often open at the prior close, so the body’s shade says almost nothing there. On those charts, act only when the candle forms at a support level visible on the daily timeframe.
How Reliable Is an Inverted Hammer Before Confirmation?
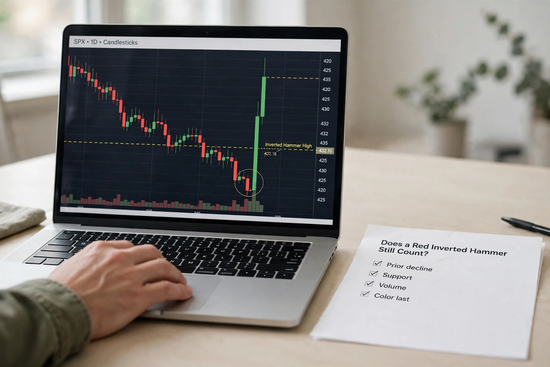
Not reliable enough to trade alone. Without a follow-through candle, the pattern fails more often than it succeeds.
Thomas Bulkowski’s daily-chart research on ThePatternSite shows the downtrend resuming after 65% of inverted hammers. Buy every one on sight, and the price moves against you on roughly 13 of every 20 entries before commissions or slippage enter the math.
The fix is a confirmation close. Traders use one of two rules:
- Conservative: wait for the next session to close above the inverted hammer’s high.
- Aggressive: accept a close above the top of the body.
Apply that rule to every alert you receive. If you track reversal setups through the watchlists on 5starsstocks .com. treat each inverted hammer there as “pending” until the confirmation close prints.
Sizing a Trade From the Example
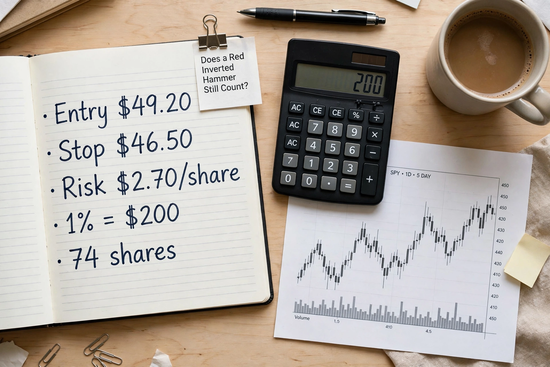
Start with the stop, then work backward to share the count. Say the confirming candle closes at $49.20, just above the $49.00 high, and you place a stop at $46.50, ten cents under the low.
That puts $2.70 per share at risk. With a $20,000 account and a 1% risk limit of $200, the position works out to 74 shares.
A 2:1 reward target lands at $54.60. Because that level sits above the $52 point where the slide began, taking partial profits near $52 locks in gains at a likely resistance zone.
The Common Mistake: Grading by Color Instead of Context
Beginners often skip red inverted hammers at genuine lows while buying green ones in the middle of a choppy range. Charting apps paint gains green, green reads as go, and the eye trusts color over location. The fix is a fixed grading order:
- Prior decline
- Nearby support
- Volume
- Color, last
How Do You Tell an Inverted Hammer From a Shooting Star?

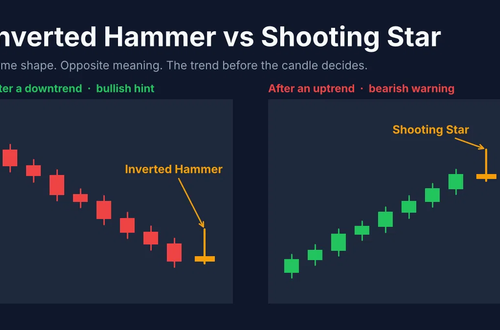
Check the trend before the candle. The same silhouette changes its name and its expected direction depending on whether a decline or a rally preceded it.
The inverted hammer vs shooting star mix-up happens constantly because the two candles look identical: small body, tall upper wick. After a drop, call it an inverted hammer; after a climb, call it a shooting star. If the trend looks unclear, zoom out to the weekly chart, because a candle sitting mid-range carries no reversal meaning at all.
| Pattern | Long wick | Prior trend | Textbook signal | Tested result on daily charts | Source |
| Inverted hammer | Upper | Downtrend | Bullish reversal | The downtrend resumes. 65% of the time (ranks 6th of 103 after confirmation) | Thomas Bulkowski, ThePatternSite |
| Shooting star | Upper | Uptrend | Bearish reversal | Reverses lower 59% of the time. | Thomas Bulkowski, ThePatternSite |
| Hammer | Lower | Downtrend | Bullish reversal | Reverses higher 60% of the time | StockCharts |
| Hanging man | Lower | Uptrend | Bearish reversal | Uptrend continues 59% of the time. | Thomas Bulkowski, ThePatternSite |
The inverted hammer’s two figures measure different things. Its failure rate counts how often price breaks the wrong way, while its overall rank also weighs how far price travels after a confirmed breakout, which is exactly why waiting for confirmation pays.
Does Color Matter for the Hammer and Hanging Man Too?
Only slightly. Shape and prior trend define both patterns, and body color nudges conviction at the margin.
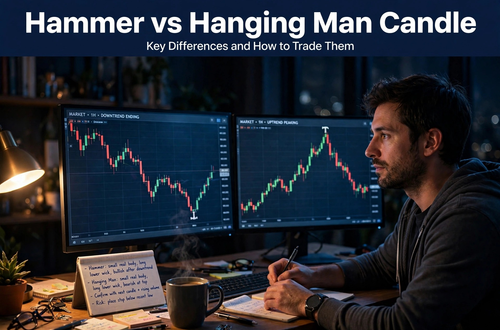
The hammer vs hanging man candle pair mirrors the upper-wick pair, with the long shadow pointing down instead. A green hammer shows buyers finished the recovery above the open, but a red hammer at support still qualifies. A red hanging man adds some bearish weight, since buyers failed to hold even the open after the deep intraday dip.
The tested record in the table argues for patience with the hanging man in particular. Wait for a lower close before treating it as a top, and let color shift your grade by one notch without ever turning a pass into a fail.
Can Long-Term Investors Use a Red Inverted Hammer to Time Buys?
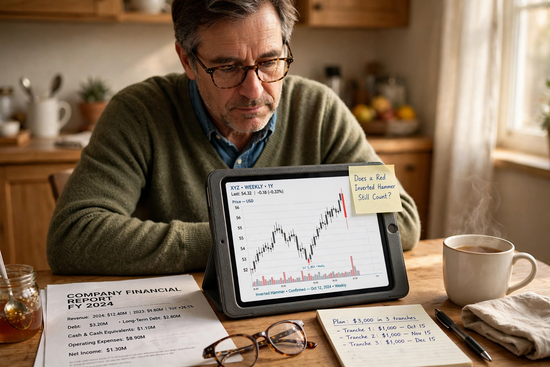
Yes, but only to time a purchase you already planned. A single candle says nothing about earnings, debt, or valuation, and those drive returns over years.
Gallup’s 2025 stock ownership survey found that 62% of U.S. adults own stock, counting shares held in 401(k) plans and IRAs. For most of those owners, steady contributions matter far more than one session’s price action, so use the pattern only to time a purchase you already planned.
Suppose you plan to invest $3,000 in one company over three months. A confirmed inverted hammer gives a sensible day to place the first $1,000 tranche, not a reason to commit the full amount at once. Do the fundamental work first. Even the best stocks deserve a check of revenue trend, debt load, and valuation; once a stock passes, a confirmed inverted hammer simply helps you pick the entry day.
Frequently Asked Questions
Is a red inverted hammer bullish or bearish?
It is a mildly bullish warning sign whose bias stays unproven until the next candle closes higher. The red body shows sellers held the close, so rank it below a green version.
Is a green inverted hammer always stronger than a red one?
Not always, because location and confirmation outweigh body color. A red candle at major support on heavy volume beats a green one floating in the middle of a range.
How do you confirm an inverted hammer?
Wait for the next session to close above the inverted hammer’s body, or above its high for a stricter test. Above-average volume on that confirming day adds weight.
Is a shooting star just an inverted hammer at the top of a trend?
Yes, the shape is identical, and only the preceding rally turns it into a bearish warning. The same body-color logic applies, with a red body adding slightly more bearish conviction.
Which timeframe works best for inverted hammers?
Daily and weekly charts give the most dependable readings for individual shares. Intraday candles form constantly and throw off many false signals unless they sit at a major support level.
What volume should an inverted hammer have?
Volume above the 20-day average on the pattern day or the confirmation day strengthens the signal. Thin volume suggests the intraday rally lacked broad participation.
Conclusion
Does a red inverted hammer still count? Yes. Shape and location define the pattern, and color only grades its strength. Use the grading order: prior decline, then support, then volume, and color last. Demand a higher close the next session, and size every trade so a failure costs only what you planned to lose.
This article is for education only and is not financial advice. Trading involves risk of loss.