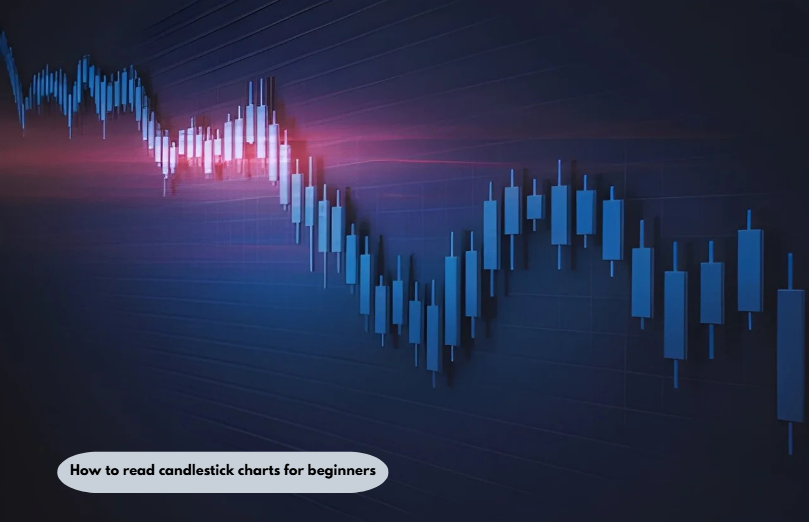
The first step in how to read candlestick charts for beginners is understanding the four prices each candle holds: open, high, low, and close for one period. A green or hollow body means the price finished higher than it started, a red or filled body means it finished lower, and the wicks mark the highest and lowest points reached.
Key Takeaways
- Each candle captures four prices from one period: opening, highest, lowest, and closing.
- A green body means the period closed above its open, and a red body means it closed below its open.
- Wicks mark the highest and lowest prices traded, so a long wick shows a price level that buyers or sellers rejected.
- Dividing a candle’s body by its full range tells you how decisive the period was, with large ratios signaling conviction and tiny ratios signaling indecision.
- A pattern carries real weight only when it appears after a clear trend, near a proven price level, and on above-average volume.
What Is a Candlestick Chart?
A candlestick chart is a price chart that draws each time period as a rectangle with thin lines attached, showing where trading started, where it finished, and how far it stretched in both directions.
The method grew out of Japanese rice trading, and it reached most American traders through Steve Nison’s book Japanese Candlestick Charting Techniques, published by the New York Institute of Finance in 1991. Your brokerage app almost certainly defaults to this format, so learning it once lets you read nearly any chart you open.
How Do You Read a Single Candlestick?
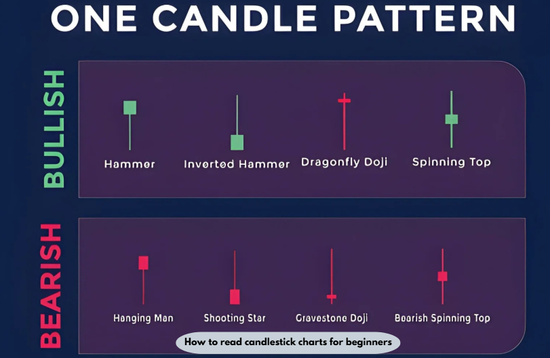
Read a single candlestick in three passes: check its color, then the size of its body, then the length of each wick. Those three details tell you who won the period, by how much, and where the fight got rejected.
The Body
The body is the thick rectangle between the opening and closing prices. On green candles, the body’s lower edge marks the open and its upper edge the close. On a red candle, the order flips. Some platforms use hollow and filled bodies instead of colors, but the logic is identical.
The Wicks
The wicks, also called shadows, are the thin lines above and below the body, and their tips mark the period’s high and low. A long upper wick means buyers pushed the price up, but sellers dragged it back down before the close. A long lower wick means the reverse: sellers pushed hard, and buyers recovered the ground.
The Timeframe
Each candle covers whatever period you select, from one minute to one month. On a daily chart of a U.S. stock, one candle normally reflects the New York Stock Exchange’s core session, which runs from 9:30 a.m. to 4:00 p.m. Eastern time. If you check a chart at 1 p.m., today’s candle is still forming, and its color can flip before the closing bell.
How to Read Candlestick Charts for Beginners in 5 Steps
Start with the big picture, zoom in on the latest candles, and finish by confirming with volume. Following the same order every time keeps one flashy candle from overriding everything else on the chart.
- Pick your timeframe. Use a daily chart showing about six months of data if you hold positions for weeks, or a weekly chart if you hold for years, which suits most buyers of income stocks.
- Identify the trend. Rising highs and rising lows signal an uptrend; falling highs and falling lows signal a downtrend.
- Mark support and resistance. Draw horizontal lines where price has turned at least twice; these levels give later candles their meaning.
- Read the latest three to five candles. Note their colors, compare their body sizes with the previous ten candles, and look for unusually long wicks.
- Check volume. The volume bars below the chart track trading activity; a reversal candle backed by above-average volume carries much more weight than one on thin trading.
After these five steps, wait for the next candle to confirm the signal before you act.
What Do the Most Common Candlestick Patterns Mean?
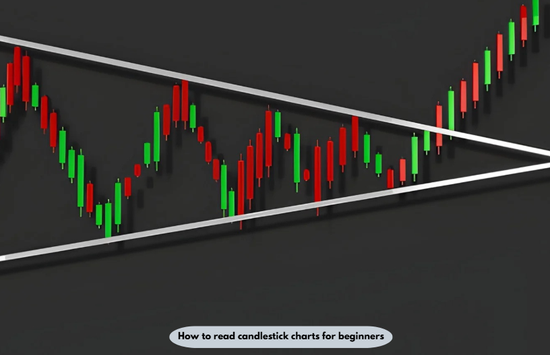
Most patterns signal one of three things: indecision, a possible reversal, or continuation of the current move. The table below covers six shapes worth recognizing first.
| Pattern | What It Looks Like | What It Suggests | Where It Matters Most |
| Doji | Open and close nearly equal; tiny body | Buyers and sellers are balanced. | After a long run in either direction |
| Hammer | Small body at top; lower wick at least twice the body | Sellers lost control during the period | At support after a decline |
| Shooting star | Small body at bottom; long upper wick | Buyers lost control during the period. | At resistance after a rally |
| Bullish engulfing | The green body fully covers the prior red body. | Momentum shifted toward buyers. | Near the end of a downtrend |
| Bearish engulfing | The red body fully covers the prior green body. | Momentum shifted toward sellers. | Near the end of an uptrend |
| Marubozu | Long body with little or no wick | One side controlled the entire period. | At the start of a breakout |
How Do You Measure Whether a Candle Is Strong or Weak?
Divide the body by the candle’s full range. The higher the percentage, the more firmly one side controlled the period by the close.
Picture a hypothetical stock whose daily candle opens at $48.20, climbs to a high of $51.00, slips to a low of $47.60, and closes at $50.50.
- Full range: $51.00 minus $47.60 comes to $3.40.
- Body: $50.50 minus $48.20 comes to $2.30.
- Body-to-range ratio: $2.30 divided by $3.40 works out to 67.6%.
- Upper wick: $0.50, which is 14.7% of the range. Lower wick: $0.60, which is 17.6%.
Buyers owned about two-thirds of the day’s movement and gave back very little, which marks a strong bullish candle. Now suppose the next day opens at $50.50, ranges from $49.80 to $52.10, and closes at $50.60. The body is $0.10 against a $2.30 range, a ratio of just 4.3%, so the previous day’s momentum stalled into a near-doji.
A practical working rule: treat ratios above 60% as conviction, 10% to 60% as ordinary trading, and below 10% as indecision. These cutoffs are guidelines rather than market laws, but they replace vague impressions like “that looks big” with a number you can compare across any chart, whether you’re studying the best stocks on your watchlist or a company you’ve just discovered.
What Mistakes Do Beginners Make When Reading Candlesticks?
The biggest mistake is acting on one candle without checking the trend, nearby price levels, and volume. Three errors account for most early losses.
Trading the pattern alone. Pattern guides show shapes in isolation, so beginners expect a hammer to work anywhere.
Fix: require three agreements before acting, namely the pattern, a support or resistance level, and above-average volume.
Reading an unfinished candle. A hammer at 2 p.m. turns into a plain red candle by 4 p.m. surprisingly often.
Fix: base decisions on closed candles only.
Mixing timeframes. A bullish five-minute candle means little inside a weekly downtrend.
Fix: Let the longer timeframe set your direction, and use shorter ones only for timing.
When the Usual Rules Break
Candlestick signals lose reliability in three situations. After an earnings report, a stock often gaps far above or below the prior close, so the opening price reflects overnight news rather than trading pressure, and the normal body-and-wick reading no longer applies. Thinly traded stocks that change hands only a few thousand shares a day produce erratic wicks from single orders. Shortened holiday sessions also create small candles that look like indecision but simply reflect fewer trading hours.
How Do Candlestick Charts Fit Into Picking Stocks?
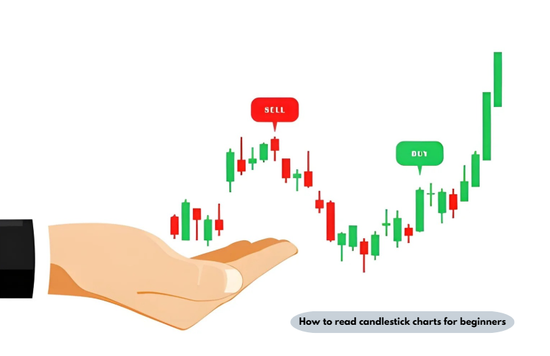
Candlesticks tell you when to act, not what to buy. Pair chart reading with research on the business itself before you put money into any of your stocks.
Gallup’s April 2025 survey found that 62% of Americans report owning stock. If you belong to that majority mainly through a 401(k) or index fund, you do not need daily candles at all; save chart reading for individual purchases.
Candlesticks are only part of how to read a stock chart for beginners, since moving averages and volume complete the picture. Screeners that rank the best value stocks to buy or the best stocks by earnings growth narrow your list, and ideas from a newsletter or a site like 5starsstocks .com still deserve a chart check before you buy. For income stocks, a weekly chart is usually enough, because dividend investors care more about the long-term trend than daily swings.
Frequently Asked Questions
How long does it take to learn to read candlestick charts?
Most beginners can read single candles within a day and recognize basic patterns after a few weeks of regular practice. Reviewing ten closed daily charts each evening and labeling the trend, levels, and patterns builds the skill quickly.
What do red and green candles mean?
A green candle shows the price finished above its opening level; a red one shows it finished below. Color ignores the prior session, so a green candle may still close under the previous day’s close.
Which chart timeframe is best for beginners?
Most beginners do best starting with the daily chart. It filters out minute-by-minute noise while still showing enough candles to spot trends and patterns within a few months of data.
Are candlestick patterns reliable?
No pattern works every time, so treat each one as a shift in odds that needs confirmation. Patterns improve noticeably when they form at a tested support or resistance level on heavy volume.
What is the difference between a candlestick chart and a line chart?
Line charts plot just closing prices, whereas candlestick charts display the open, high, low, and close. That extra detail reveals rejected price levels and intraday swings that a line chart hides.
Can you use candlestick charts for long-term investing?
Yes, long-term investors can use weekly or monthly candlesticks to judge broad trends. A monthly candle condenses about 21 trading days into one shape, which makes multiyear support levels easy to see.
Conclusion
Learning how to read candlestick charts for beginners comes down to four prices, three visual checks, and one ratio: body divided by range. Identify the trend, verify it with levels and volume, and trade only completed candles. Practice on past charts before risking money, and each candle becomes a short, readable record of who controlled the market.