

The long upper wick vs long lower wick meaning is simple: an upper wick says sellers refused higher prices; a lower wick says buyers refused lower ones. Neither shadow predicts direction alone; its meaning depends on the prior trend, nearby support or resistance, and the next candle’s close.
Key Takeaways
- A long upper wick shows rejected highs, and a long lower wick shows rejected lows.
- The same shape changes meaning with the prior trend, so one lower wick can be a hammer or a hanging man.
- As a rule of thumb, a wick counts as a signal when it is at least twice the body and at least 60% of the range.
- Single-wick patterns only modestly beat a coin flip, and two of the four usually do the opposite of what textbooks say, so they work best for placing entries and stops.
What Is a Candlestick Wick?
A candlestick wick is the thin line above or below a candle’s body that marks how far the price traveled beyond the open and close during that period.
How Do You Read the Parts of a Candlestick?
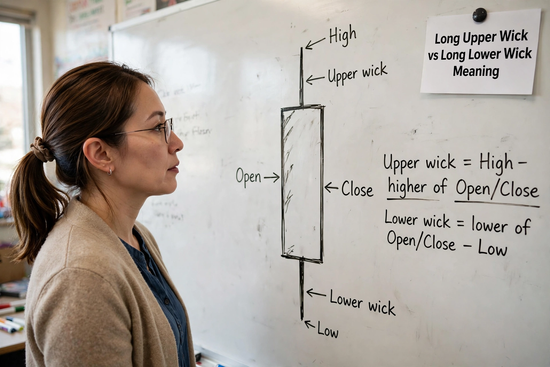
Each candlestick shows the open, high, low, and close prices. The body spans open to close, and two formulas size the wicks:
- Upper wick = high minus the higher of the open or close.
- Lower wick = the lower of the open or close minus the low.
Divide either wick by the full range to compare a $5 stock fairly with a $500 stock. Then check volume: a wick on volume well above the 20-day average means many shares traded at the rejected prices, while a thin-volume wick often reflects a handful of orders.
So what does a candle with no wick mean? The open and close landed at the session’s extremes, so one side controlled every minute; traders call this a marubozu, and it signals conviction rather than rejection.
Long Upper Wick vs Long Lower Wick Meaning on a Candlestick?
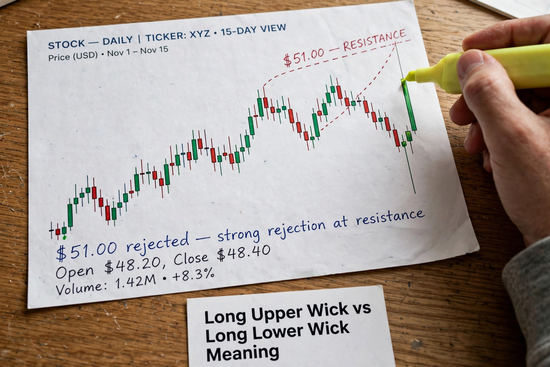
A long upper wick means buyers drove the price higher during the session, then sellers forced it back down before the close. The market tested a higher level and refused to hold it.
Picture a stock opening at $48.20, spiking to $51.00, dipping to $47.90, and closing at $48.40. Buyers trapped near $51 often sell the next bounce to break even, which turns the wick’s tip into fresh resistance. Several upper wicks stalling at one price mark a sturdier ceiling than one dramatic spike.
Watchlist tools like 5starsstocks .com make this easy to spot in practice: when a momentum stock from your list runs hard for a month and then prints a long upper wick on heavy volume, it often shows late buyers meeting large sellers. That’s a cue to tighten your stop rather than chase the move.
Shooting Star vs Inverted Hammer
A shooting star shows a long upper wick following a rally; an inverted hammer has that same shape following a price drop. Position determines the name.
After a drop, sellers erased most of the rally, so an inverted hammer needs a strong green candle the next day before anyone treats it as a bottom.
What Does a Long Lower Wick Mean?
A long lower wick means sellers pushed the price down hard, then buyers lifted it back near the open or higher. The tail marks a level where demand overwhelmed supply for that session.
Swing traders often set stops a few cents beneath the wick’s low, since a close below it erases the buyers’ defense.
Hammer vs Hanging Man
A hammer shows a long lower wick following a decline, while a hanging man is that identical candle following a rally. The first hints at support; the second signals weakening demand.
The hanging man’s deep intraday drop proves sellers can knock the stock down fast. A gap lower the next morning confirms the warning.
Should Long-Term Investors Read Lower Wicks?
Long-term investors can read weekly lower wicks to time entries, but wicks never replace business analysis.
Gallup’s 2025 polling found that 62% of U.S. adults own stock, counting 401(k) plans and IRAs. Most of that money arrives through automatic payroll contributions, where daily wicks add only noise.
When screening income stocks, a long lower weekly wick holding above support works as a timing filter, used only after the payout record and balance sheet pass inspection.
Long Upper Wick vs Long Lower Wick: How Do the Signals Compare?
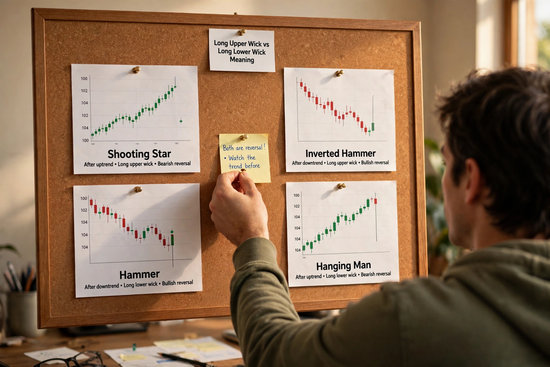
The upper wick leans bearish at resistance, and the lower wick leans bullish at support. Tested results put both closer to a coin flip than textbooks admit.
| Pattern | Wick | Prior trend | Textbook signal | Tested result | Source |
| Shooting star | Long upper | Uptrend | Bearish reversal | Bearish reversal 59% of the time | Thomas Bulkowski, ThePatternSite |
| Inverted hammer | Long upper | Downtrend | Bullish reversal | Bearish continuation 65% of the time | Thomas Bulkowski, ThePatternSite |
| Hammer | Long lower | Downtrend | Bullish reversal | Bullish reversal 60% of the time | Thomas Bulkowski, ThePatternSite |
| Hanging man | Long lower | Uptrend | Bearish reversal | Bullish continuation 59% of the time | Thomas Bulkowski, ThePatternSite |
In the inverted hammer and hanging man rows, the tested outcome points opposite the textbook label, so the trend usually keeps going.
Thomas Bulkowski’s research ranked the hammer 65th among 103 candle patterns for overall performance. With 64 patterns showing stronger follow-through, a lone hammer deserves a small position at most.
That gap explains why the best guides on how to read candlestick charts for beginners focus on multi-candle setups that build confirmation into the shape. Treat a single wick as half a signal.
How Do You Measure a Wick and Trade It?
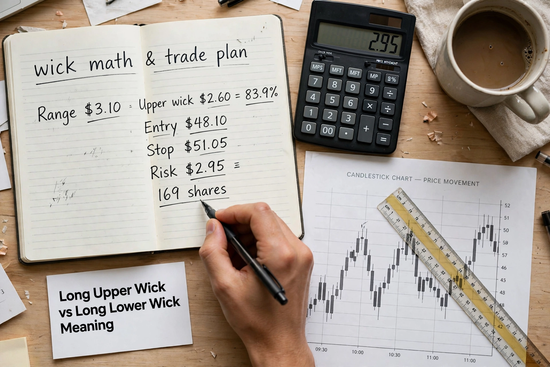
Measure the wick against both the body and the total range, then trade only after the next candle confirms.
In the $48.20 example, the range is $3.10, the upper wick $2.60, and the body $0.20, so the wick fills 83.9% of the range and runs 13 times the body.
- Confirm the trend: five to seven candles moving one way.
- Mark the level: the wick tip should touch prior support or resistance, a round number, or the 50-day average.
- Run the math: Wick at least twice the body and 60% of the range on above-average volume.
- Wait for confirmation: a close beyond the wick candle’s body in the expected direction.
- Set the stop beyond the wick tip, then size the trade from that distance.
A trader shorting at $48.10 with a stop at $51.05 risks $2.95 per share, so a $500 limit allows 169 shares.
Patient traders wait for a retest of the wick’s midpoint, $49.70. The same stop then risks $1.35 per share, allowing 370 shares for the same $500, though some retests never arrive.
If you’re learning how to understand candlestick patterns, this simple sequence (measure, locate, confirm, and size) will serve you better than memorizing fifty pattern names.
What Mistakes Do Traders Make With Wick Signals?
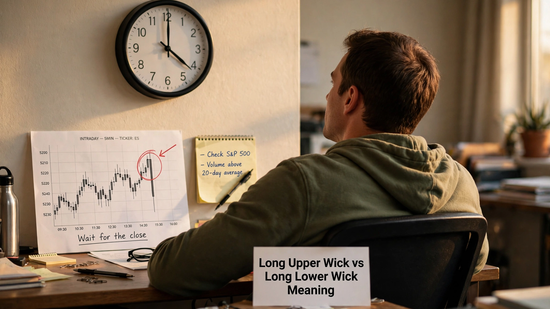
The biggest mistake is reading a wick without its location, and the second is acting before the session closes.
A midday hammer can turn into a full red body after a late sell-off, so judge wicks only after the close.
Market context causes a quieter error. Even the best stocks print long lower wicks when the whole market dumps at the open and recovers by afternoon, so check whether the S&P 500 printed the same wick before crediting stock-specific buyers.
FINRA’s Regulatory Notice 26-10 ended the $25,000 pattern day trader minimum, effective June 4, 2026, though brokers have until October 20, 2027 to adopt it A $5,000 account now trading intraday wicks can cap each loss at $50 by risking 1% per idea, so ten straight failures cost about a tenth of the account.
Wick rules break down in thinly traded stocks and on news days. One odd print in a low-float stock can paint a wick no real crowd created, and an earnings-day wick often reflects a single headline. Many traders skip wick signals on earnings days and require a liquidity floor, such as 500,000 shares of average daily volume.
FAQ
Is a long upper wick bullish or bearish?
A long upper wick tilts bearish, since sellers pushed prices back down before the session ended. After a downtrend, the same shape becomes an inverted hammer.
Is a long lower wick always bullish?
No, a long lower wick is not always bullish, because its meaning depends on the trend before it. After a rally it forms a hanging man, a warning sign.
How long should a wick be to count as a signal?
A common rule of thumb is that a wick should be at least twice the length of the body and cover at least 60% of the candle’s range. Shorter shadows usually reflect ordinary price swings.
Which timeframe gives the most reliable wick signals?
Daily and weekly charts give more dependable wick signals than intraday charts. Longer candles hold more volume, so a rejection reflects many participants.
Can a candle have long wicks on both sides?
Yes, a candle with long wicks on both ends and a small body is a spinning top or long-legged doji. It signals indecision, so traders wait for the next close.
Conclusion
The long upper wick vs long lower wick meaning is simple: an upper shadow shows highs got rejected, while a lower one shows lows did. Only location, size, and a confirming close make either a trade; otherwise, a wick is just a line.
This article is meant for educational use only, not as financial advice. You can lose money trading.


