
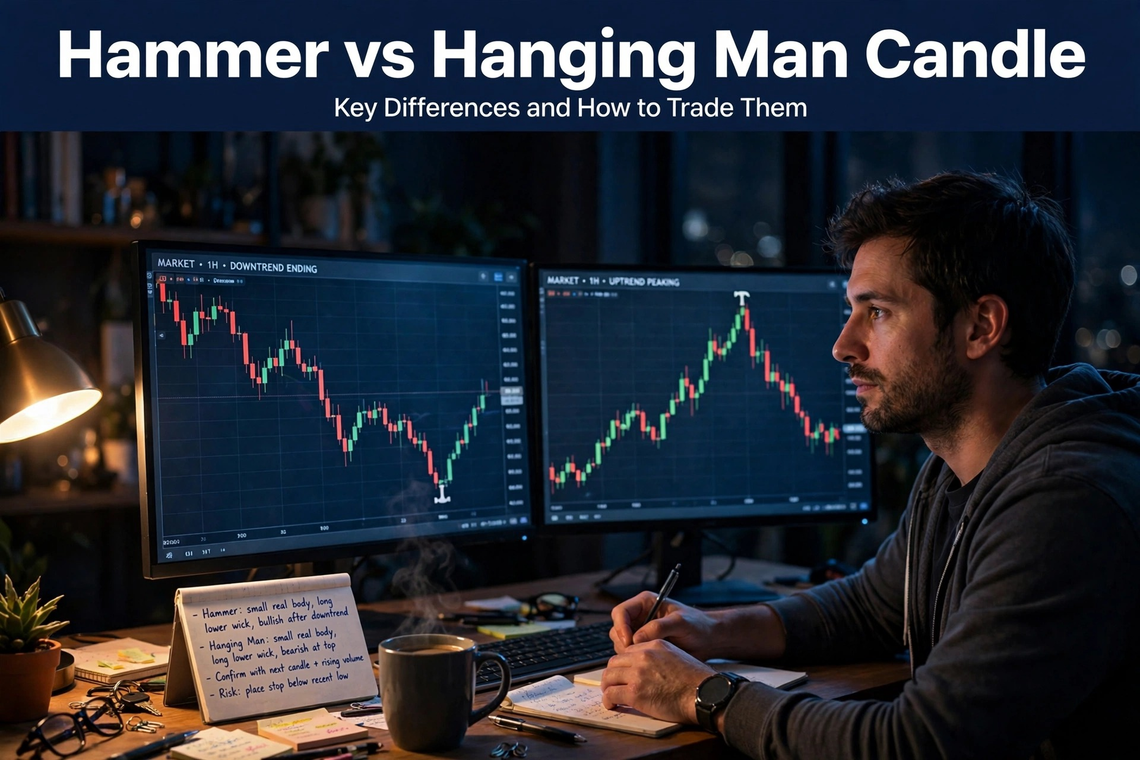
The hammer vs hanging man candle question confuses many beginners because both share one shape: a small body sitting atop a long lower shadow. Trend sets the label: a bullish hammer follows a decline, a bearish hanging man follows a rally, and neither becomes a trade until the next candle confirms the turn.
Key takeaways
- A hammer and a hanging man have identical anatomy, and only the trend before the candle separates them.
- A hammer forms after a decline and shows buyers rejected lower prices during the session.
- A hanging man forms after an advance and shows sellers tested the market’s floor.
- Neither candle is a signal alone; a confirming close in the next session triggers the trade.
- Position size comes from the distance between entry and stop, never from how convincing the candle looks.
What is a hammer or hanging man candle?
A hammer or hanging man is a single candlestick whose small real body sits near the top of the session’s range, with a lower shadow at least twice the body’s height and little or no upper shadow.
Anyone learning how to understand candlestick patterns should start with the four prices behind every bar: open, high, low, and close. Here, the lower shadow records price falling far below the open, then climbing back before the bell.
Hammer vs hanging man candle: What is the difference?
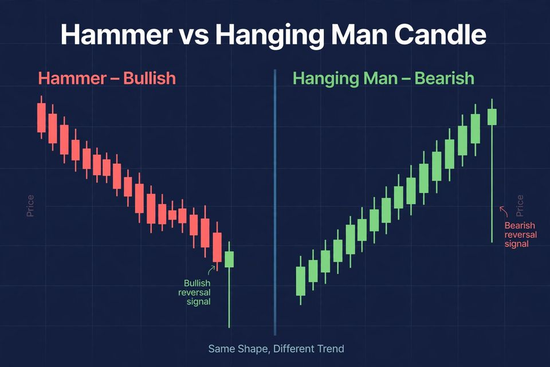
Location is the difference. A hammer prints after a decline, a hanging man prints after an advance, and the same silhouette tells two opposite stories.
After a slide, the shadow shows sellers pushed hard, ran out of fuel, and let buyers close near the high. After a rally, it marks the first serious wave of selling, even though bulls repaired the damage.
| Candle | Prior trend | Long shadow | Textbook signal | Tested result | Source |
| Hammer | Downtrend | Lower | Bullish reversal | Bullish reversal 60% of the time; performance rank 65 of 103 | ThePatternSite, Thomas Bulkowski |
| Hanging man | Uptrend | Lower | Bearish reversal | Bullish continuation 59% of the time; performance rank 87 of 103 | ThePatternSite, Thomas Bulkowski |
| Inverted hammer | Downtrend | Upper | Bullish reversal | Bearish continuation 65% of the time | ThePatternSite, Thomas Bulkowski |
| Shooting star | Uptrend | Upper | Bearish reversal | Bearish reversal 59% of the time | ThePatternSite, Thomas Bulkowski |
Read the hanging man row closely. It counts continuations, not reversals, so its bearish follow-through rate works out to roughly 41%, while the hammer’s figure measures the very turn it promises.
That gap changes your job. Treat a hanging man as a cue to protect an existing long, and treat a hammer as a cue to start hunting for an entry.
How do you trade a hammer candle?
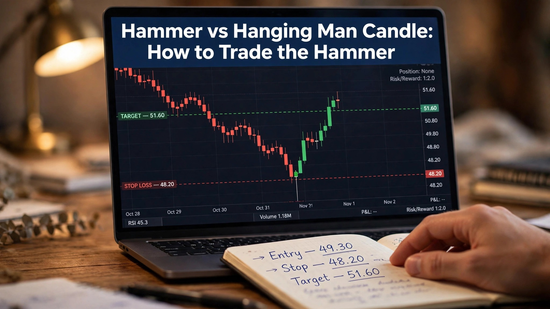
Wait for the next session to close above the hammer’s high, then park a stop just under its low. Size the position from that stop distance.
- Confirm the trend: look for at least five sessions of lower highs and lower lows before the candle.
- Measure the shape: the bottom wick should be at least double the body, with barely any upper wick.
- Check location: support, a prior swing low, or a round number adds weight.
- Wait for confirmation: the following session must close above the hammer’s high.
- Run the math: set the stop, compute share size, and compare the target against the risk.
Worked example: the reward-to-risk trap
Picture one of the value stocks on your watchlist sliding for two weeks and then printing a hammer: open $47.10, high $48.00, low $45.20, close $47.80. The lower shadow measures $1.90 against a $0.70 body, about 2.7 times larger, so the shape qualifies.
The next day closes at $48.40. Buying there with a stop at $45.10 risks $3.30 per share, and a $25,000 account risking 1%, or $250, can hold 75 shares.
Now check the reward. In Thomas Bulkowski’s testing on ThePatternSite, the price reached a target built by projecting the hammer’s height 88% of the time in the best scenario, a bull market with an upward breakout. Here the candle’s $2.80 height puts that target at $50.80, only $2.40 above entry, so you would risk $3.30 to make $2.40.
That is the mistake most new traders miss. A late confirmation leaves little room before the target, and the fix is a better entry, not a looser stop.
Place a limit order at the hammer’s body midpoint, $47.45, after confirmation. Risk drops to $2.35, reward grows to $3.35, and the ratio flips to about 1.4 to 1, with 106 shares fitting the same $250 budget. No pullback means no trade and no loss.
How do you trade a hanging man candle?
Use a hanging man first as a stop-management signal for positions you already hold. Short it only after a later session closes below the candle’s low.
- Start with a real scenario: Suppose you bought 200 shares at $100, and the stock ran to $112 over three weeks. A hanging man appears: open $111.60, high $112.20, low $108.40, close $112.00.
- Protect your gains first: Raise your stop to $108.30, just under the shadow. If the stock keeps climbing, you stay in; if it breaks down, you exit with at least $8.30 per share, or $1,660, locked in.
- Wait before shorting: Demand a close below $108.40 first, because the tested record shows uptrends usually shrug this candle off.
- Let the next sessions decide: Tighten the stop anyway, then watch the next two sessions to see whether buyers return.
Inverted hammer vs shooting star: what about candles with a long upper shadow?
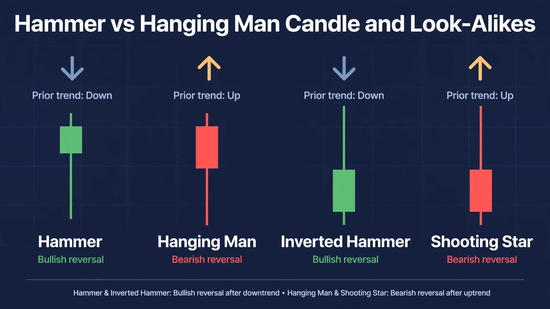
Flip the shadow upward and you get a second look-alike pair. The same trend-first rule decides which candle you are reading.
Inverted hammer vs shooting star comes down to the same trend test as the lower-shadow pair: the inverted hammer follows a decline, the shooting star follows a rally, and both show an intraday spike that sank back toward the open.
The table shows the inverted hammer fails at its job more often than it succeeds, so it requires a strong close above its high on rising volume before buying. The shooting star beats a coin flip, barely.
How many stocks should a beginner own while learning candlestick patterns?
Keep the practice list short: five to ten liquid stocks you study daily, held beside a diversified core such as a broad index fund.
To build that shortlist, some traders start with screening or rating sites such as 5starsstocks .com then study the charts themselves. Ratings help you decide what to watch; candles help you decide when to act. A strong rating never cancels a bearish candle like the hanging man.
How many stocks should a beginner own? No universal number exists, but chart practice favors depth over breadth. Heavily traded companies print cleaner candles than thin small caps.
Gallup’s 2025 survey put stock ownership at 62% of U.S. adults, a count that includes shares held through 401(k) plans and IRAs. Own a retirement fund already? Then you hold hundreds of companies indirectly, and your trading account need not carry the diversification load.
The same survey found ownership near 87% in households earning $100,000 or more, against roughly 28% below $50,000. Smaller accounts make the 1% rule more important: on $5,000, a trade should risk about $50, which buys just 21 shares using the $47.45 limit entry from the hammer example above.
A short list also makes record-keeping practical. Log every setup by ticker, candle type, entry, stop, and result, and the patterns in your own mistakes surface within a few weeks.
When does the usual candle advice not apply?
Ex-dividend dates and earnings releases break the standard reading.
On an ex-dividend morning, a $60 stock paying $0.90 opens roughly $0.90 lower for purely mechanical reasons; if buyers lift it back, the chart draws a hammer-like shadow that reflects bookkeeping, not rejection. The distortion grows with the payout, so income stocks with large quarterly dividends print the most convincing fakes. Earnings gaps create the same illusion, so ignore single-candle signals on those dates and wait two or three sessions for normal trading to resume.
FAQ
Is a hanging man bullish or bearish?
A hanging man is bearish in theory but often precedes higher prices in practice. Treat it as a warning to tighten stops, and let the next close decide.
Does the color of a hammer matter?
Color matters less than trend, location, and confirmation. A green body adds a little conviction, but a red hammer at strong support still deserves attention.
What timeframe works best for these candles?
Daily and weekly charts give the most reliable readings because each candle reflects a full session of decisions. Five-minute candles generate far more false shadows.
How do you confirm a hammer candle?
Confirm a hammer candle only when the next session closes above its high. A gap up that fades back below the body cancels the setup.
Should beginners trade candlestick patterns with real money?
Beginners should paper trade first and log at least 20 setups before risking cash. The log shows whether your entries, stops, and targets earn a positive average result.
Conclusion
The hammer vs hanging man candle question always returns to context: one shape, two trends, and two opposite warnings. Trade the confirmation, size every position from the stop, and skip any setup where the target sits closer than the risk.





2 Comments on “Hammer vs. Hanging Man Candlestick: Key Differences and How to Trade Them ”