
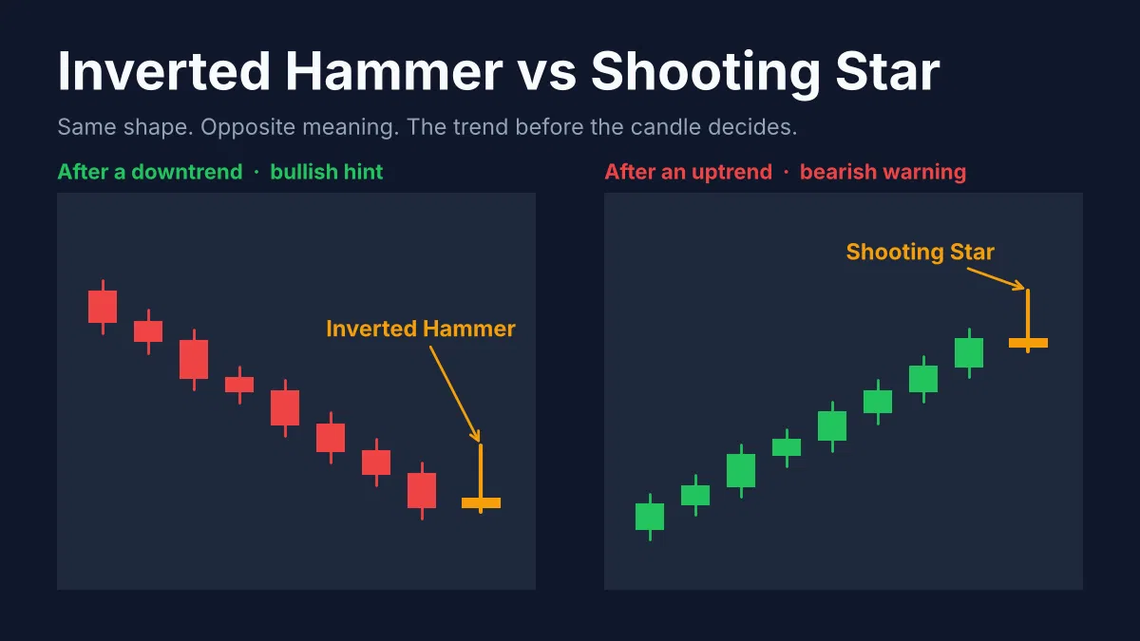
The inverted hammer vs shooting star difference is location, since both candles have a small body near the low and a long upper wick. An inverted hammer appears after a decline and hints at a bullish turn, while a shooting star appears after a rally and warns of weakness.
Key Takeaways
- An inverted hammer and a shooting star share the same shape, and the trend before the candle decides which name applies.
- Neither candle is a trade signal on its own, because each one needs a confirming close in the next session.
- Historical testing shows the inverted hammer is far less reliable as a bullish signal than most textbooks suggest.
- A stop just above the shooting star’s high, or just below the inverted hammer’s low, defines your risk before you enter.
What Is an Inverted Hammer and a Shooting Star?
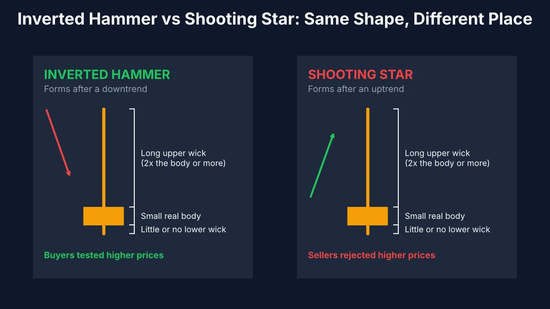
An inverted hammer and a shooting star are single candlesticks with a small real body near the session’s low and an upper wick at least twice as long as that body.
The lower wick is tiny or missing, and color matters far less than position. Learning how to understand candlestick patterns starts with this habit: treat each candle as a scoreboard showing who controlled the open, who reached the extremes, and who owned the close.
Inverted Hammer vs Shooting Star: How Do You Tell Them Apart?
Check the trend before the candle. The same shape after a decline is an inverted hammer; after an advance, it is a shooting star.
Both record a failed push: the price climbed well above the open, then gave most of it back. After a selloff, that means buyers finally showed up; after a rally, it means sellers were waiting overhead. The reading works the same way on stocks and ETFs, provided the chart uses regular-session data, since thin premarket trades can stretch a wick that never mattered.
| Feature | Inverted Hammer | Shooting Star |
| Trend before the candle | Down | Up |
| Textbook signal | Bullish reversal | Bearish reversal |
| Tested behavior | Bearish continuation 65% of the time | Bearish reversal 59% of the time |
| Overall performance rank (1 = best of 103) | 6 | 55 |
| Frequency rank (1 = most common) | 61 | 37 |
Sources: trend and signal rows follow the standard pattern definitions; tested behavior and rankings are from Thomas Bulkowski, ThePatternSite.
The two hit rates measure different outcomes. One counts how often price kept falling after an inverted hammer, and the other counts how often price reversed after a shooting star, so the inverted hammer’s bullish label held up only about 35 times in 100. The performance rank measures something else again: how far price travels after it breaks out of the candle, not how often the candle predicts the right direction. That is why the inverted hammer can rank 6th for move size while still failing as a bullish signal most of the time.
How Do You Read Each Candle, Step by Step?
Measure the open, high, low and close, then compare the body with each wick. Most lessons on how to read candlestick charts for beginners skip this arithmetic, yet the ratios decide whether a candle qualifies.
- Calculate the real body by taking the gap between the open and close: the higher price minus the lower price.
- Measure the upper wick: session high minus the higher of the open and close.
- Measure the lower wick by subtracting the session low from the lower of the open and close.
- Confirm that the upper wick is at least twice as long as the body and that the lower wick is no more than about 10% of the full range.
- Compare the close with the close 10 sessions earlier to name the trend.
- Wait until the next candle closes before you act.
A Worked Example With Real Numbers
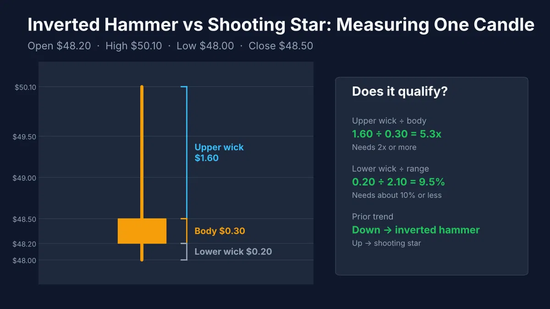
Picture a stock that opens at $48.20, rallies to $50.10, dips to $48.00 and closes at $48.50. The body measures $0.30, and the upper wick runs $1.60, roughly 5.3 times the body.
The lower wick is just $0.20, about 9.5% of the $2.10 range.
If the stock slid from $55 to $48 over the prior two weeks, you are looking at an inverted hammer; if it climbed from $42 to $48, those identical four prices form a shooting star.
What Confirms Each Pattern?
Confirmation comes when the next candle closes in the expected direction. An inverted hammer needs a close above its body, and a shooting star needs a close below its body. Volume adds weight: a confirming candle on above-average volume shows more traders backing the move.
Thomas Bulkowski’s research in the Encyclopedia of Candlestick Charts found that shooting stars hit their price target 84% of the time in bear markets once price broke downward, and that the ordinary hammer reversed upward in 60% of cases. The two numbers track different events: the first applies only after a breakdown, which makes the confirming close your trigger, while the second shows the best-known bullish candle beating a coin flip by just 10 percentage points.
Confirming an Inverted Hammer
Look for the next session to finish above $48.50, the top of the body in the example. A close beyond the $50.10 high is stronger, and a stop a few cents under $48.00 caps the loss if buyers fail. Mark the nearest prior swing high as well, a habit covered in any guide on how to read a stock chart for beginners, because a confirmation that clears it removes the next layer of sellers.
Confirming a Shooting Star
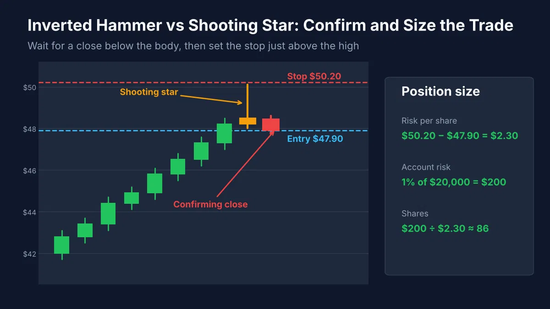
Look for a close below $48.20, the bottom of the body. Say that close comes at $47.90, and you place a stop at $50.20, a dime above the high.
Your risk is $2.30 per share. On a $20,000 account risking 1%, or $200, that allows 86 shares.
What Mistakes Do Traders Make With These Candles?
The biggest mistake is buying an inverted hammer the moment it prints. Price continues lower after this candle more often than it turns up, so an unconfirmed entry fights the odds.
Textbooks file the candle under bullish reversals, yet its tall wick shows buyers who tried and lost. Fix it by waiting for a close above the body at minimum, and ideally above the candle’s high, plus a nearby support level such as a prior swing low or the 200-day moving average.
A second mistake is treating every candle with a long upper wick as a reversal. Does a doji candle mean a reversal? Not by itself. A doji shows a draw between buyers and sellers; the gravestone doji, with a long upper wick and almost no body, sits closest to a shooting star and needs the same confirming close.
A third error is ignoring volume. A shooting star printed on roughly 1.5 times the 20-day average volume shows heavy selling into the high, while a thin-volume star often reflects a quiet afternoon rather than real rejection.
Readers of 5starsstocks .com who scan a watchlist every evening can avoid all three mistakes with one rule: flag the candle that night, then act only after the next session’s close.
Do These Patterns Matter for Long-Term Investors?
Yes, as a timing tool rather than a reason to buy. Long-term investors use these candles to choose better entry and exit points on companies they already researched.
Gallup’s 2025 survey found that 62% of U.S. adults own stock in some form, including shares inside a 401(k) or IRA. Paycheck-deduction investors in that group can ignore candles entirely, but a lump-sum buyer loses only one day by waiting for confirmation.
How Different Investors Use Each Candle
Each investing style gets something different from the same two patterns.
- Value buyers: Buyers of value stocks often watch for an inverted hammer near a 52-week low as an early hint that selling is drying up.
- Dividend holders: Owners of income stocks can treat a confirmed shooting star near a prior peak as a cue to trim, not exit, which keeps most of the dividend stream intact.
- Growth investors: A confirmed inverted hammer that holds above the 200-day moving average marks a cleaner spot to add shares than a random weekday.
Why Weekly Charts Work Better
Weekly charts suit long-term holders best. One weekly candle compresses five sessions of noise, so a confirmed weekly shooting star carries more weight than any single daily candle.
The tradeoff is a wider stop. Cut the position size so your dollar risk stays the same.
When to Ignore the Pattern
Earnings days break the usual reading. When a stock gaps up on a report and fades by the close, the long upper wick reflects one news event and thin early trading, not a real shift in supply. Skip the pattern that day and wait for two or three normal candles.
Frequently Asked Questions
Is an inverted hammer bullish or bearish?
An inverted hammer carries a bullish label, but it becomes a buy signal only after the next candle closes above its body. Unconfirmed, it more often precedes further declines.
Is a shooting star always bearish?
No, a shooting star is bearish only when it follows a clear rally and the next session closes lower. Inside a sideways range, it is just one rejected bar.
What is the difference between a hammer and an inverted hammer?
A hammer has its long wick below the body, while an inverted hammer has its long wick above the body. Both appear after declines, but the hammer shows buyers rescuing a drop, and the inverted hammer shows a stalled rally attempt.
Which chart timeframe works best for these candles?
Daily and weekly charts give the most dependable readings for both patterns. Five-minute charts produce many lookalikes driven by random order flow.
Where should you place a stop-loss on a shooting star trade?
Place the stop slightly above the shooting star’s high, because a close beyond that level cancels the pattern. Divide your dollar risk by the distance from entry to stop to set your share count.
Conclusion
The inverted hammer vs shooting star question never turns on shape, because both candles look identical; the trend before them decides the name. A confirming close turns either one from a hint into a signal, and without that close, the disciplined move is to wait.
This article is meant for educational purposes only and should not be taken as financial advice. Trading involves risk, including loss of principal.


2 Comments on “Inverted Hammer vs Shooting Star: What’s the Crucial Difference?”