
Asking “Does a doji candle mean a reversal?” gets a clear answer: not on its own, because a doji only shows buyers and sellers ending the session in a stalemate. Trade it only after a confirmation candle closes beyond its range, with trend, location, volume, and momentum agreeing.
Key Takeaways
- A doji forms when a session’s open and close land at nearly the same price, which signals fading momentum rather than a confirmed turn.
- A lone doji points in no direction, and the candle after it decides whether a reversal has started.
- Three-candle doji patterns, such as the morning and evening doji stars, test far better than single doji candles.
- Five checks filter out weak signals: prior trend, key level, confirmation close, relative volume, and higher-timeframe momentum.
- A stop placed just beyond the doji’s far wick defines your risk before you enter.
What Is a Doji Candle?
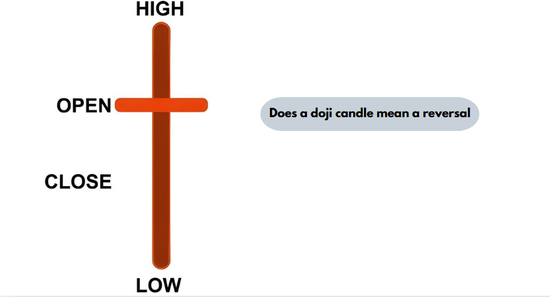
A doji candle is a price bar whose open and close sit so close together that the body shrinks to a thin line, leaving the wicks to show how far price traveled during the session.
Why does a doji form?
Buyers and sellers end the session evenly matched. A trend runs on one-sided pressure, so a session with zero net progress tells you the dominant side has stopped winning. Spotting that loss of pressure is the first skill in reading candlestick charts (see our beginner’s guide to candlestick charts).
How close is “almost equal”?
The body should measure no more than 5% to 10% of the candle’s high-to-low range. On a $3.00 range, that means a body of 15 to 30 cents or less.
Doji vs. spinning top
A spinning top keeps a small visible body, usually 10% to 30% of its range. A doji has almost none, so it marks a tighter stalemate.
Where did the doji come from?
Japanese rice traders built candlestick charting in the 1700s, and “doji” roughly means “at the same time.” Steve Nison brought candlesticks to Western traders in the early 1990s.
What Are the Main Types of Doji Candles?
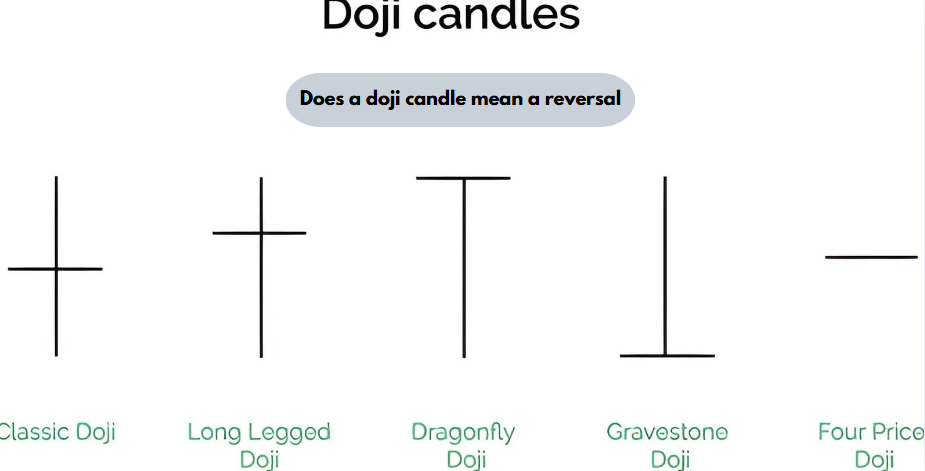
Five doji shapes appear on stock, forex, and crypto charts, and each one shows where the fight happened during the session. If you’re new to charts, start with our guide to reading a stock chart.
| Doji type | What it looks like | What it signals | Best context to watch |
| Standard doji | Short wicks on both sides | Simple pause in the trend | After five or more trending candles |
| Long-legged doji | Very long wicks on both sides | Violent two-way fight that ended even | Near major support or resistance |
| Dragonfly doji | Long lower wick, open and close at the high | Sellers failed to hold lower prices. | At support after a decline |
| Gravestone doji | Long upper wick, open and close at the low | Buyers failed to hold higher prices. | At resistance after a rally |
| Four-price doji | A flat dash with no wicks | Almost no trading | Mostly ignore |
Does a Doji Candle Mean a Reversal on Its Own?
No. A single doji marks indecision, and indecision resolves in either direction, so the candle needs a follow-through bar before it tells you anything.
Thomas Bulkowski’s pattern testing shows the gap between single dojis and multi-candle doji patterns.
| Pattern | What textbook theory predicts | Tested result | Source |
| Dragonfly doji (single candle) | Bullish reversal during a decline | Reversed 50% of the time | Thomas Bulkowski, ThePatternSite |
| Bullish doji harami (harami cross) | Bullish reversal | Price kept falling 55% of the time. | Thomas Bulkowski, ThePatternSite |
| Bullish tri-star | Bullish reversal | Bullish reversal 60% of the time | Thomas Bulkowski, ThePatternSite |
| Bearish abandoned baby | Bearish reversal | Bearish reversal 69% of the time | Thomas Bulkowski, ThePatternSite |
| Evening doji star | Bearish reversal | Bearish reversal 71% of the time | Thomas Bulkowski, ThePatternSite |
| Morning doji star | Bullish reversal | Bullish reversal 76% of the time | Thomas Bulkowski, ThePatternSite |
The lone dragonfly lands on a coin toss. The star and abandoned baby patterns score highest because their final candle supplies the confirmation.
| Single doji | Doji star pattern | |
| Candles | 1 | 3 |
| Confirmation built in | No | Yes |
| Tested reversal rate | ~50% | 71–76% |
Which doji patterns produce stronger reversals?
- Morning doji star: a tall red candle, a doji gapping lower, then a tall green candle.
- Evening doji star: the mirror image at the top of a rally.
- Doji harami: a doji sitting inside the prior candle’s body, which still needs a third candle to confirm.
- Abandoned baby: a rare doji that gaps away from the candles on both sides.
- Tri-star: three dojis in a row, with the middle one gapping away.
The rule that matters most: judge every candle by its neighbors, never alone. Our candlestick patterns guide applies this to other formations.
What 5 Confirmations Should You Check Before Trading a Doji?
Check the prior trend, the price level, the next candle’s close, the volume, and higher-timeframe momentum. Skip the trade if two or more fail.
- Prior trend. Look for five to seven candles moving in one direction into the doji.
- Location. The doji should print at a prior swing high or low, a round number, or the 50-day or 200-day moving average.
- Confirmation close. For a bullish reversal, the candle after the doji needs to finish above the doji’s high; for a bearish reversal, it needs to finish below the doji’s low.
- Rising volume. The confirmation candle’s volume should be no less than one and a half times its 20-day average. Always compare against that ticker’s own average, since “high volume” for a small-cap and a mega-cap are very different numbers.
- Higher-timeframe momentum. The weekly trend should point the same way as your trade.
Before trading a doji, ask:
- Trend: Did a clear trend lead into the doji?
- Location: Did it print at a key level?
- Confirmation: Did the next candle close beyond its range?
- Volume: Did volume reach 1.5x the 20-day average?
- Momentum: Does the weekly trend agree with the trade?
Risk check: Do I know my stop and position size before entering?
Which indicators pair best with a doji?
- RSI: a reading above 70 at a top or below 30 at a bottom shows a stretched move.
- MACD: a signal-line cross near the doji supports the turn.
- Bollinger Bands: a doji outside a band that closes back inside marks exhaustion.
- Moving averages: the 50-day and 200-day lines act as ready-made support and resistance.
AI charting tools can scan thousands of tickers for a doji paired with an extreme RSI reading. Treat each alert as a starting point, then run the five checks yourself.
Does Context Change What a Doji Means?
Yes. Timeframe, market, trend location, and candle size all change how much a doji counts.
Timeframe. Daily and weekly dojis carry weight. On a 5-minute chart they appear constantly and mean little.
Market type. U.S. stocks gap overnight, so gap patterns such as the abandoned baby form. Forex trades five days around the clock and rarely gaps. Crypto trades 24/7, and each exchange sets its own daily close.
Location and size. A doji after a long rally or a run of large candles signals a sharp loss of momentum. The same candle in the mid-range means almost nothing.
How Do You Trade a Confirmed Doji?
Enter on the confirmation close, set the stop just beyond the doji’s far wick, and size the position so a stop-out costs about 1% of your account.
Example 1: a reversal that worked
In this hypothetical, shares slid from $62 to $48, and a doji printed on the 200-day moving average: open $48.10, close $48.05, high $49.40, low $46.90. The next session closed at $49.80 on 1.6 times average volume.
Entry at $49.80 with a stop at $46.80 risks $3.00 a share. On a $20,000 account, a 1% risk cap ($200) buys 66 shares. The $54.80 target sits $5.00 above entry, a reward-to-risk ratio of 1.67 to 1.
Example 2: a doji that failed
Here, shares rallied from $80 to $95, and a gravestone doji formed with a high of $97.10 and a low of $94.60. The next candle closed at $94.30, but volume was only 1.1 times average, and the weekly trend was still rising.
A short at $94.30 with a $97.20 stop risked $2.90 a share, or 68 shares. The price ran to $98 two sessions later, and the loss came to $197.20. This trade broke the two-failures rule: volume came in at only 1.1x and the weekly trend still pointed up. Even the best stocks print dojis that fail, which is why the stop goes in before the trade does.
What mistake do beginners make most often?
They buy the doji itself instead of waiting for confirmation, because the tight stop looks cheap. The fix: no entry until a candle closes beyond the doji’s range.
Separate the two jobs: stock research sites like 5starsstocks can help you decide what to own, while the doji only helps you decide when to enter.
When Should You Ignore a Doji Completely?
Ignore dojis on shortened holiday sessions, inside sideways ranges, or right before earnings, since those stalemates reflect thin or event-driven trading.
Long-term holders of value stocks and income stocks face a different calculation. A doji changes nothing about a company’s earnings or dividend, so trading around it adds tax bills without lifting returns.
Frequently Asked Questions
Is a doji bullish or bearish?
A doji is neutral by itself, and its direction comes from the trend before it and the candle after it. A close above its high after a decline turns it bullish.
How reliable is a doji candle?
A single doji is about as reliable as a coin toss, while multi-candle doji patterns with a built-in confirmation candle perform noticeably better. Volume and location filters improve the odds further.
What happens after a doji candle?
After a doji, the price either resumes the old trend, reverses, or drifts sideways, and the next one or two closes reveal which. Most traders act on a close beyond the doji’s range.
Is a gravestone doji always bearish?
No, a gravestone doji is bearish only after a rally and only once the next candle closes below its low. Elsewhere it simply shows a failed push higher.
How long should you wait for confirmation after a doji?
Wait one to two candles for a close beyond the doji’s high or low. If neither arrives, the setup no longer qualifies.
Is a spinning top the same as a doji?
No, a spinning top keeps a small visible body, while a doji’s body is close to zero. Both signal hesitation.
Conclusion
Does a doji candle mean a reversal? Only when the next candle closes beyond its range with trend, location, volume, and momentum lined up behind it. Treat every doji as a question, and let the confirmation close answer it before your money does.
Risk disclaimer: This article is for education only and is not investment advice. Trading involves the risk of loss, and past pattern statistics do not guarantee future results.