

Researching a stock before buying means checking its business model, financial statements, valuation ratios, growth trends, and competitive position before committing money. A complete check takes 30–45 minutes per company and prevents the two most common beginner mistakes: buying on hype and ignoring the balance sheet.
Stock research replaces guesswork with evidence. Knowing how to research a stock before buying helps investors understand what they own instead of relying on price momentum or headlines alone—avoiding the single largest driver of early portfolio losses among new retail traders.
Key Takeaways
- Research a stock in five steps: business model, financial statements, valuation ratios, growth outlook, and ownership activity.
- A full research pass takes 30–45 minutes once the process is repeatable.
- The S&P 500’s trailing price-to-earnings ratio sat near 26 in September 2026, above its long-term average, per GuruFocus data.
- Trailing P/E (past earnings) and forward P/E (estimated future earnings) measure different things and should not be compared as if interchangeable.
- Beginners should prioritize profitable, low-debt companies with understandable revenue models over speculative, high-volatility names.
What Is Stock Research?
Stock research is the structured evaluation of a company’s financial health, business model, and market price to judge whether its shares are a sound investment.
How to Research a Stock Before Buying: Step-by-Step

Researching a stock before buying follows a repeatable five-step sequence that takes under an hour once practiced.
Step 1: Understand the Business Model
A company’s business model explains how it makes money, who its customers are, and what stops competitors from taking market share. This question alone filters out roughly half of unsuitable candidates before any numbers are checked.
Identify three things:
- What product or service generates most of the revenue
- Who the primary customers are (consumers, businesses, or government)
- What advantage—cost, brand, patent, or network—protects that revenue
Step 2: Read the Financial Statements
The income statement, balance sheet, and cash flow statement together show whether a company is profitable, solvent, and generating real cash, not just reported earnings. Reported profit can be adjusted through accounting choices; cash flow is harder to manipulate.
Focus on four numbers:
- Revenue growth over the last three years
- Net profit margin versus industry peers
- Debt-to-equity ratio, ideally under 1.0 for non-financial companies
- Free cash flow, which should be positive in most years
Step 3: Compare Valuation Ratios
Valuation ratios like price-to-earnings and price-to-sales help show whether a stock is expensive or cheap compared with its own history and industry peers, rather than in absolute terms. A ratio only carries meaning next to a benchmark.
In September 2026, the trailing P/E ratio of the S&P 500 was close to 26, higher than its multi-decade norm. Its forward P/E—based on projected next-twelve-month earnings instead of past results—ran closer to 22 in the same period. These figures measure different time horizons and are not interchangeable; conflating them distorts whether the market is actually overvalued.
Step 4: Evaluate Growth and Competitive Position
Sustainable growth means growing revenue and margins without relying heavily on debt or constantly issuing new shares. A company growing sales 20% a year while diluting shareholders 15% a year is not creating value at the pace it appears to be. Rising share count without matching profit growth is a warning sign, not a footnote.
Step 5: Check Insider and Institutional Activity
Insider buying—executives or directors purchasing shares with personal money—is one of the few signals that can’t be easily faked, since it requires a financial commitment from people with direct company knowledge. Insider selling is far less informative, since executives sell for many neutral reasons, including taxes and diversification.
How do beginners choose their first stock?
Beginners benefit most from picking among the best stocks to buy for beginners using criteria they can verify themselves: consistent profitability, low debt, and a business model that can be explained in one sentence.
- Three consecutive years of positive earnings
- Debt-to-equity ratio under 1.0
- A revenue source the investor already understands
- No reliance on constant new share issuance to fund growth
What should you look for in a long-term stock?
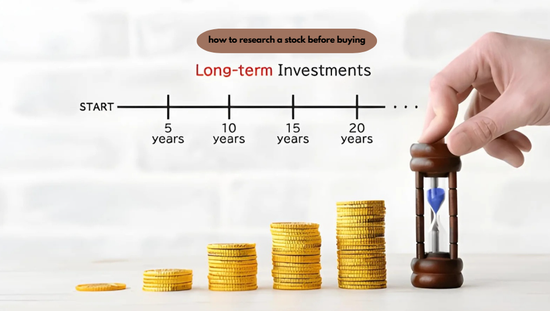
Long-term investing rewards companies with durable competitive advantages and disciplined capital allocation across multiple economic cycles. Investors working out how to choose stocks for long term investing should weigh qualitative durability—brand strength, switching costs, patents—as heavily as current-year numbers, since those advantages protect returns when the broader market turns down. A single strong year says little; performance through at least one recession says a great deal.
Screening for Value Stocks
A value stock trades at a lower price relative to its earnings or assets than its historical average or peers, without a business deterioration that justifies the discount. Investors searching for the best value stocks to buy often confuse “cheap” with “value”—the table below separates the two.
| Screening Step | Surface-Level Screen | Verified Value Candidate |
| P/E ratio vs. industry | Lower than peers | Lower than peers AND stable over 3 years |
| Debt level | Not checked | Debt-to-equity under 1.0 |
| Earnings trend | Ignored | Flat or growing, not declining |
| Reason for discount | Unknown | Identified and explainable |
| Insider activity | Not checked | No sustained insider selling |
An Original Framework: The Research Depth Score

Most checklists list what to check but not how much checking is enough. Score one point for each item reviewed before a purchase:
- Revenue source
- Customer concentration
- Three-year revenue trend
- Net margin trend
- Debt-to-equity ratio
- Free cash flow
- Share count trend
- P/E versus peers
- P/E versus the company’s own five-year average
- Insider transactions, last two quarters
- One identified competitor
- One identified business risk
A score of 9 or higher indicates thorough due diligence. A score under 5 correlates with a decision driven by price movement or a headline—the exact pattern behind most first-time investor losses. This scoring method does not appear in standard brokerage research guides, which list categories without quantifying how many must be completed before a decision is defensible.
Where Research Tools Fit In
Screening platforms speed up early filtering but don’t replace the five-step process above. A tool such as 5starsstocks .com can surface candidates matching criteria like low debt or consistent dividends, narrowing thousands of companies to a shortlist in minutes. From there, an investor still needs to check the actual financial statements, since automated screens typically apply only two or three filters, while a defensible decision requires closer to nine or ten factors from the framework above.
Platforms built around 5starsstocks.com income stocks criteria tend to filter primarily on dividend yield and payout history—that alone doesn’t confirm the business can sustain the payout through a downturn. A comparable pattern applies to 5starsstocks.com best stocks lists: they identify candidates worth a closer look, not finished conclusions.
Common Mistakes and Exceptions

Rules-based checklists miss real judgment calls:
- A company with temporarily high debt from a recent acquisition isn’t automatically disqualified if the acquired business adds proportional cash flow within two years—a strict debt-to-equity screen would filter it out incorrectly.
- A young, unprofitable company isn’t automatically weak if its cash burn funds measurable customer growth rather than unexplained losses.
- The most common beginner mistake is treating a falling share price as proof of a buying opportunity without checking whether the underlying business justified the drop. Price declines are tied to industry-wide conditions—comparable to patterns tracked in NAHB’s homebuilder confidence index—differing meaningfully from declines caused by company-specific failures.
Frequently Asked Questions
How long does it take to research a stock before buying?
A thorough check of a single stock takes 30 to 45 minutes for an investor following a repeatable five-step process. The time drops as the process becomes routine. Complex companies with multiple business segments or heavy debt can take longer.
What is the most important thing to check before buying a stock?
The most important check is whether the company generates positive free cash flow, since reported profit can be adjusted through accounting choices in ways cash flow cannot. Even when a business is losing money, it might nonetheless report an accounting profit. The more difficult figure to alter is free cash flow.
Are stock-screening tools reliable for beginners?
Screening tools are useful for narrowing a large universe of stocks to a manageable shortlist, but they shouldn’t replace an independent check of the financial statements. Automated filters apply a limited number of criteria. A shortlist is a starting point, not a final answer.
What financial ratios matter most for long-term investing?
Debt-to-equity, return on equity, and free cash flow margin matter most, since they reveal whether growth is funded sustainably. Revenue growth alone doesn’t indicate quality if it comes with rising debt. Review all three across a three-year trend rather than a single year.
Is a low P/E ratio always a sign of a good value stock?
No—a low P/E ratio only signals value when the earnings behind it are stable or growing; paired with declining earnings, it often reflects a business in genuine decline. The ratio needs context from debt level and earnings trend before it means anything.
How do beginners avoid common stock-picking mistakes?
Beginners avoid the most common mistakes by checking debt levels and profit trends before checking the stock price, since price alone reveals nothing about business quality. Buying based on recent price movement, without checking the underlying financials, is the leading cause of early losses.
What is the difference between growth stocks and value stocks?
Growth stocks are priced for expected future earnings expansion, while value stocks are priced below what their current earnings or assets would justify. Growth stocks typically carry higher valuation ratios and higher volatility; value stocks carry lower ratios and, historically, steadier returns.
Conclusion
Researching a stock before buying comes down to five checks: business model, financial statements, valuation against peers, growth trend, and insider activity. Knowing how to research a stock before buying helps you avoid relying on price movement or headlines alone. Skipping any one—especially the financial statements—is what separates an informed purchase from a guess. Investors who apply this process consistently build the habit that most reliably compounds into long-term returns.




3 Comments on “How to Research a Stock Before Buying: A Simple Investor’s Guide”