Learning how to understand candlestick patterns starts with reading each candle’s open, high, low, and close, then comparing its body to its wicks against the prior trend. Don’t trade a pattern alone. It only counts once the next candle confirms it and the volume backs the move.
Key Takeaways
- Every candlestick records four prices for one period: the open, the high, the low, and the close.
- The body shows the distance between the open and the close, while the wicks show how far the price traveled beyond that range.
- A single candle carries little meaning until you compare it with the trend that came before it.
- Beginners should wait for a confirmation candle before entering any trade based on a pattern.
- A pattern sets your entry and stop-loss levels, but your position size should come from a fixed dollar-risk rule.
What Is a Candlestick Pattern?
A candlestick pattern is a shape formed by one to three price candles that signals whether buyers or sellers are likely to control price in the short term.
Japanese rice traders built the method centuries ago, and Western traders learned it largely from Steve Nison’s Japanese Candlestick Charting Techniques, which the New York Institute of Finance released in 1991. That gives the core patterns 35 years of use on U.S. charts, which is why almost every free charting platform now shows candles by default.
How Do You Read a Single Candlestick?
Read a candle by checking its color first, then measuring its body against its wicks. Color shows direction for the period, and proportions show how firmly that direction held.
This is the first skill in how to read a stock chart for beginners, because every larger pattern is assembled from these two parts.
The Body
The body is the thick rectangle between the open and the close. A green or hollow body means the price closed above its open, and a red or filled body means it closed below.
A long body shows one side pushed hard for the whole session. A very thin body, called a doji when the open and close nearly match, shows a standoff between buyers and sellers.
The Wicks
Wicks, also called shadows, are the thin lines above and below the body. The top of the upper wick is the session high, and the bottom of the lower wick is the session low.
A long lower wick means sellers dragged the price down, but buyers pulled it back up. A long upper wick means the opposite: buyers tried to lift the price, and sellers pushed it back down.
How to Understand Candlestick Patterns Beginners Use Most
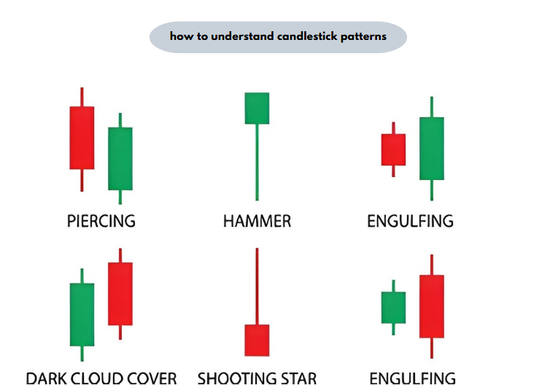
Start with six patterns that cover reversals and indecision, and learn the measurable rule behind each one. Every rule below can be checked with a calculator instead of judged by eye.
| Pattern | Candles | Shape rule | Where it must appear | Signal / Implication |
| Hammer | 1 | Lower wick twice the body or longer; upper wick tiny or missing | After a decline | Buyers rejected lower prices |
| Hanging man | 1 | Same shape as a hammer | After a rally | Selling pressure is building |
| Shooting star | 1 | Upper wick at least 2x the body, small lower wick | After a rally | Buyers failed to hold higher prices |
| Bullish engulfing | 2 | Green body fully covers the prior red body | After a decline | Buyers took control |
| Bearish engulfing | 2 | Red body fully covers the prior green body | After a rally | Sellers took control |
| Doji | 1 | Open and close within about 5% of the day’s range | Strongest at trend extremes | Indecision before a possible turn |
Notice that the hammer and the hanging man have identical shapes. Location alone decides which one you are looking at, which is the single most important rule on the chart.
Context also includes what drives the company. A doji at a yearly high on a slow-moving consumer staples name deserves attention, while the same doji on a healthcare company awaiting a drug approval says little, because the news will set the next move.
How Do You Trade a Candlestick Pattern Step by Step?
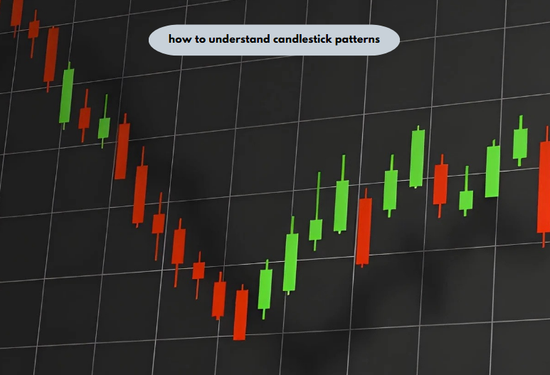
Trade a pattern by confirming it, placing a stop beyond its extreme, and sizing the position from a fixed dollar risk. These five steps turn a shape into a defined trade:
- Label the trend over the prior 10 to 20 candles as up, down, or sideways.
- Measure the candle against the shape rule in the table.
- Wait for the next candle to close above the pattern’s high (bullish) or below its low (bearish).
- Place a stop-loss just past the pattern’s opposite extreme.
- Divide your dollar risk by the distance between entry and stop to get your share count.
Worked Example: Sizing a Hammer Trade
A share price falls for two weeks, then prints this daily candle: open $48.20, high $48.60, low $46.10, close $48.50. The body is $0.30, the lower wick is $2.10, and the upper wick is $0.10.
The lower wick is seven times the body, so the candle passes the hammer test easily. The close sits 96% of the way up the $2.50 daily range, which shows buyers finished the session in control.
The next candle closes at $48.80, above the hammer’s high, so you buy at $48.80 and set a stop at $46.00. Your risk per share is $2.80.
With a $10,000 account and a 1% risk rule, you can lose $100 on this trade. Dividing $100 by $2.80 gives 35 shares, a $1,708 position with a maximum planned loss of $98. The same arithmetic works at any price level, whether you trade large value stocks or small growth names.
When the Usual Rules Do Not Apply
Candlestick rules break down in thinly traded stocks and around earnings reports. In a small cannabis company trading only a few thousand shares a day, one large order can carve a long wick that reflects a single trader, not crowd sentiment. Before earnings, the next morning’s gap often opens past your stop, so the planned $98 loss grows by however far the gap jumps beyond $46.00. Skip pattern trades in the two sessions before a company reports.
What Mistakes Do Beginners Make With Candlestick Patterns?
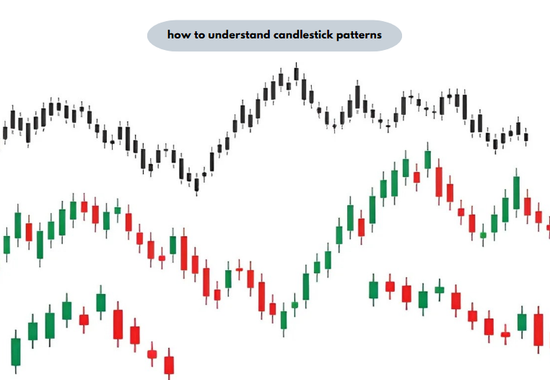
New traders slip up by ignoring context: where a candle appeared, if it got confirmed, and whether its size is typical. Each one has a quick fix.
Ignoring the Trend Before the Candle
A “hammer” that forms after a rally is really a hanging man, which is a warning, not a buy signal. The mistake happens because cheat sheets show candles alone on a blank background.
Fix: Note the direction of the prior 10 candles before naming any pattern, and skip the trade if the answer is sideways.
Trusting Patterns Without Testing Them
About 29% of U.S. investors use social media for investing information, according to the FINRA Investor Education Foundation’s 2025 study of retail investors. Short clips rarely show the confirmation candle or the stop-loss.
Fix: Before risking money, find 20 past examples on your own charts and count how often the confirmation candle actually followed.
Treating Every Long Wick as a Reversal
Fast-moving AI names often swing widely within one session, so a long wick there is usually normal noise.
Fix: Count a wick as unusual only if it is at least twice the company’s average daily range over the past 14 sessions. A high rating on sites such as 5starsstocks doesn’t change this, because the rating covers the business, and the confirmation candle still decides the entry.
The FINRA anchor phrase in the link map is unchanged, so the publishing notes still apply as written.
Do Candlestick Patterns Matter for Long-Term Investors?
Candlestick patterns help long-term investors time purchases, but they do not tell you which companies to own. Earnings growth, debt, valuation, and dividend history still decide that.
Gallup’s 2025 Economy and Personal Finance survey found that 62% of U.S. adults hold stock, the same share as in 2024. For anyone in that group adding money to an IRA or 401(k) each month, weekly candles are enough, since daily patterns mostly add noise to a decade-long holding period.
If you are working out how to choose stocks for long term investing, screen fundamentals first and use candles second. A bullish engulfing pattern on the weekly chart can then time the first buy from your shortlist.
Investors searching for the best stocks for passive income care most about dividend safety. A bearish candle on a strong dividend payer marks a cheaper entry when the payout ratio and cash flow are unchanged.
FAQ
Are candlestick patterns reliable?
Candlestick patterns are probabilities, not guarantees, and they work best with trend context and a confirmation candle. Reliability drops sharply in low-volume shares and on very short time frames such as one-minute charts.
What is the easiest candlestick pattern for beginners?
The hammer is the easiest pattern to start with because its shape rule is simple to measure. Check that the lower wick is at least twice the body and that the candle appears after a clear decline.
What time frame is best for candlestick patterns?
Daily charts are the best starting time frame because each candle reflects a full trading session. Intraday candles react to single orders and news headlines, which produces more false signals.
How many candlestick patterns should a beginner learn?
Five or six core patterns are enough to start practicing. Mastering the hammer, shooting star, engulfing patterns, and doji covers most reversal setups you will see on U.S. charts.
Do green and red candles mean buy and sell?
No, candle color only shows whether the price closed above or below its open for that period. A red candle in a strong uptrend is often a normal pause, not a sell signal.
Can you use candlestick patterns without other indicators?
Yes, but pairing patterns with volume and support levels filters out many weak signals. A hammer that forms at a prior support level on above-average volume carries more weight than one that forms in open space.
Conclusion
Knowing how to understand candlestick patterns comes down to three checks: the candle’s proportions, the trend behind it, and the confirmation after it. Measure the shape, wait for proof, and size every trade from a fixed dollar risk. Patterns tell you when to act, while research tells you what to own.