
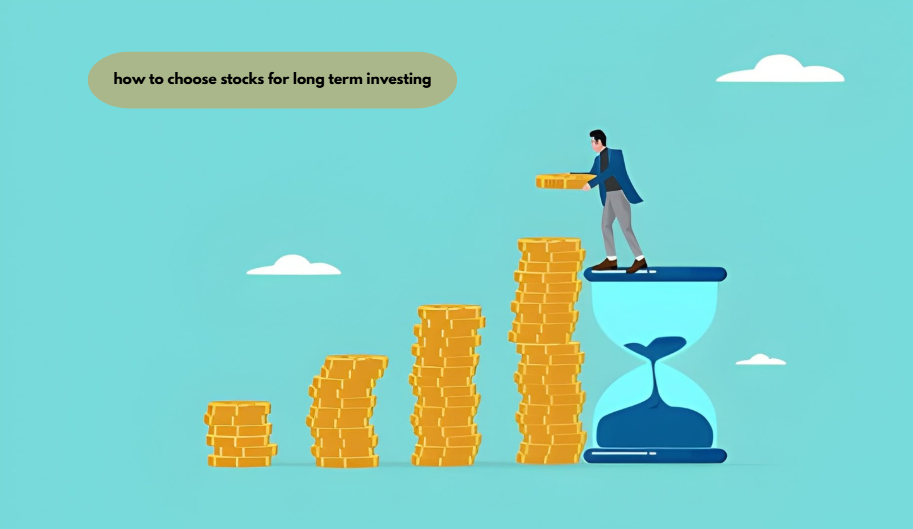
Choosing stocks for long-term investing means screening a company on growth, cash flow, debt, profitability, valuation, dividend safety, and competitive position before buying. A stock that passes most of these checks has a higher probability of compounding value over 10+ years than one picked on price momentum alone.
Learning how to choose stocks for long term investing starts with seven specific checks: revenue and earnings growth, free cash flow, debt-to-equity, return on equity, valuation against historical norms, dividend sustainability, and competitive moat. Scoring a company across all seven gives you one number, making it faster to compare candidates than reading company reports one metric at a time.
Key Takeaways
- Seven checks—growth, cash flow, debt, ROE, valuation, dividends, and moat—form a repeatable long-term stock score.
- Free cash flow is the check retail investors skip most, because P/E ratios are faster to look up and require no calculation.
- A forward P/E of 19.5 for the S&P 500 in September 2026 sits below the 5-year average but above the 10-year average, so “cheap” and “expensive” depend on which baseline is used.
- A 0–7 score gives a fast way to rank candidates before deeper research.
- The framework changes for pre-profit growth companies, where negative cash flow is normal.
What Is Long-Term Stock Investing?
Long-term stock investing is buying shares in a company with the intent to hold for five years or more, prioritizing business fundamentals over short-term price movement.
How to Choose Stocks for Long Term Investing: Start With These Fundamentals
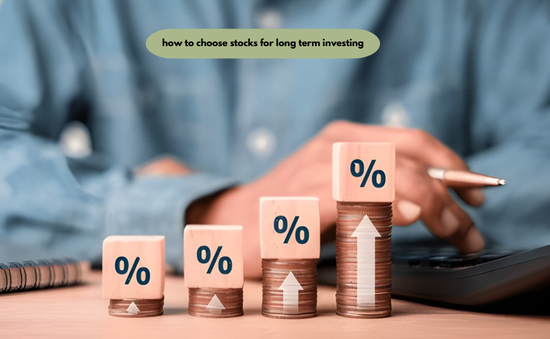
Stock selection for a long-term portfolio depends on financial statements, not stock price charts. A company’s income statement, balance sheet, and cash flow statement contain the seven data points that predict whether a business can keep compounding earnings for a decade. Price momentum, analyst upgrades, and social media buzz do not appear anywhere in that list, because none of them measure whether the underlying business is getting stronger.
The 7-Point Long-Term Stock Score
Each check below earns one point if the company passes it. Add the points for a score out of 7. This is an original scoring structure, not a single industry ratio—it forces every candidate through the same seven filters instead of relying on one metric like P/E alone.
1. Revenue and Earnings Growth Trend
A company earns a point here if revenue and net income both grew in at least three of the last five fiscal years. Consistency matters more than the size of any single year’s growth number. One strong year followed by two flat ones signals a cyclical business, not a compounding one.
2. Free Cash Flow Strength
A company passes this check if free cash flow has stayed positive and roughly tracked net income over the past three years. Free cash flow is operating cash flow minus capital expenditures—it’s the cash a business actually generates after covering its own upkeep, unlike net income, which gets muddied by non-cash accounting items. A free cash flow screener is a great way to filter out cash-burning businesses, but investors should still check operating cash flow trends by hand rather than trusting the screen alone.
3. Debt-to-Equity Ratio
A company earns a point if its debt-to-equity ratio sits below its industry median or below 1.0 for most non-financial sectors. High leverage amplifies both gains and losses, and it limits a company’s ability to invest through a recession or rate spike.
4. Return on Equity (ROE)
A company passes this check with a return on equity above 15% sustained over three years, without debt doing the heavy lifting. ROE measures how efficiently a company turns shareholder capital into profit; check the debt-to-equity number alongside it, since heavy borrowing can inflate ROE artificially.
5. Valuation vs. Historical Average
A company earns a point if its current P/E ratio sits at or below its own five-year average, adjusted for the broader market’s valuation level.
Market Context (September 2026): Right now the S&P 500 is trading at a forward P/E of 19.1, according to FactSet’s Earnings Insight. That’s a touch below the 5-year average of 19.8 but a bit above the 10-year average of 19.0—a good reminder that any valuation number only really means something when you stack it against its historical range.
6. Dividend Sustainability
A company passes this check if its dividend payout ratio stays under 60% of free cash flow, leaving room for the payment to survive a bad year. Payout ratios above that threshold often force a company to borrow to keep paying dividends during a downturn, which is how a stock investors thought was safe suddenly cuts its payment. Investors building a list of the best dividend stocks for long term holding periods should check payout ratio before yield, because a high yield paired with a payout ratio near 90% is frequently a warning sign, not a bargain.
7. Competitive Moat and Industry Position
A company earns a point if it holds a durable advantage—brand strength, network effects, patents, switching costs, or cost leadership—that competitors cannot easily replicate. A business without a moat can post strong numbers for years and still lose its position quickly once a better-funded competitor enters the market.
Why Free Cash Flow Is the Most-Skipped Check

Free cash flow is the check retail investors skip most often, ahead of debt-to-equity, ROE, and moat analysis. P/E appears on every stock screener, while free cash flow requires checking the cash flow statement and doing the math. A stock can look cheap by P/E while quietly burning cash, a gap that only shows up in the cash flow statement. Skipping this check is a common reason a cheap-looking stock becomes a long-term disappointment.
What Your 7-Point Score Means
| Score | What It Signals | Suggested Next Step |
| 6–7 | Strong long-term candidate | Add to a watchlist and size a normal position. |
| 4–5 | Mixed signals | Investigate the failing checks before buying. |
| 2–3 | Weak fundamentals | Avoid long-term holding; monitor only |
| 0–1 | High-risk profile | Skip |
A score of 6 or 7 does not guarantee future returns—it only means a company currently clears most of the fundamental filters that separate durable businesses from fragile ones.
Applying the Framework on a Small Budget
An investor doesn’t need a large account to start applying this checklist. Most major brokerages now offer fractional shares, so a search for the best stocks to buy with 100 dollars can turn into fractional positions in several companies that pass the 7-point score, rather than a full share of just one. Spreading $100 across three or four names that each score 5 or higher builds more diversification than concentrating it in a single stock, even a strong one, because it reduces the damage from any one company underperforming.
Where to Find Pre-Built Value and Income Stock Screens
Investors who want a starting list instead of screening from scratch can use pre-built stock lists organized by strategy. 5starsstocks.com value stocks lists are one example of this kind of pre-screened starting point, grouping companies by valuation criteria before an investor applies a deeper check like the 7-point score above. Pre-built lists save research time, but they should function as a first filter, not a final buy decision — every name still needs the debt, cash flow, and moat checks run individually. 5starsstocks .com and similar screening resources work best as a shortlist generator, not a substitute for reading a company’s own financial statements.
Screening for Income and Dividend Candidates

Investors focused on cash income rather than growth need a slightly different starting filter. 5starsstocks.com income stocks lists group companies by yield and payout characteristics, which can narrow a search before the dividend sustainability check gets applied. A 5starsstocks.com stocks screen organized by category—value, income, or growth—still requires the same seven-point review before any purchase, since a pre-built list filters by strategy, not by financial health.
When This Framework Doesn’t Apply
This scoring approach can miss early-stage growth companies that intentionally run negative free cash flow while scaling. A software company spending heavily on customer acquisition may fail the cash flow and debt checks while still building long-term value because its model depends on reinvestment, not current profits. Pre-profit growth stocks need more weight on revenue growth and gross margin trends. Applying this checklist too rigidly can produce a misleadingly low score.
Frequently Asked Questions
How many stocks should I own in a long-term portfolio?
Most long-term portfolios hold between 15 and 30 individual stocks to get meaningful diversification without making the portfolio too complex to track. Fewer than 10 concentrates risk in too few companies; more than 30–40 rarely adds enough diversification to justify the extra tracking, since a broad index fund can provide that exposure instead.
Is a low P/E ratio always a sign of a good stock?
No—a low P/E ratio can reflect a genuinely undervalued company or a business with declining earnings that the market is correctly pricing down. P/E needs to be checked against free cash flow, debt levels, and earnings trends before it means much on its own; a low multiple tied to shrinking, debt-funded earnings is a warning sign, not a bargain.
What counts as a good dividend payout ratio?
A payout ratio under 60% of free cash flow is generally considered sustainable for a long-term dividend holding, leaving room to maintain the payment through a weaker year. Ratios above 80-90% leave little margin and often precede a dividend cut when earnings dip, even if the company has paid consistently for years.
How much money do I need to start investing in stocks for the long term?
Fractional-share investing lets someone start with as little as $5 to $100 at most major U.S. brokerages, since a full share is no longer required to own a position. The amount matters less than starting consistently and applying a fundamentals check to each purchase rather than buying based on price alone.
What’s the difference between value stocks and growth stocks?
Value stocks trade at low prices compared to their existing earnings or assets, whereas growth stocks trade at higher multiples because the market anticipates earnings to rapidly expand. Neither category is inherently safer for long-term holding—a value stock can be cheap because its business is deteriorating, while a growth stock can justify its price if growth continues as expected.
How often should I recheck a stock I already own?
A full 7-point re-check after each quarterly earnings report catches most meaningful changes in a company’s financial health without requiring daily monitoring. Selling should be based on a check failing—rising debt, shrinking free cash flow, a broken moat—not on short-term price movement alone.
Conclusion
If you’re wondering how to choose stocks for long term investing , start by running every candidate through the same seven checks—growth, free cash flow, debt, ROE, valuation, dividend safety, and moat—rather than relying on a single number like P/E. Free cash flow is the check investors skip most often, and skipping it is a common reason a stock that looked cheap turns into a long-term loss. A 0–7 score built from these seven checks won’t predict returns, but it can filter out fragile businesses before they reach a portfolio.




One comment on “How to Choose Stocks for Long Term Investing: 7 Important Things to Check ”